
OpenVswitch/OVNKubernetes Primer (Part 1)
This article will cover some of the basics of OpenVswitch/OVNKubernetes in relation to learning the path that packets take between pods and also how services work. This article will end with a cheat-sheet on how to use OpenVswitch/OVNKubernetes for troubleshooting purposes.
I will give credit to the following websites and articles ahead of time. I am paraphrasing a lot of information contained here.
 The OVN community
What is OpenVswitch?
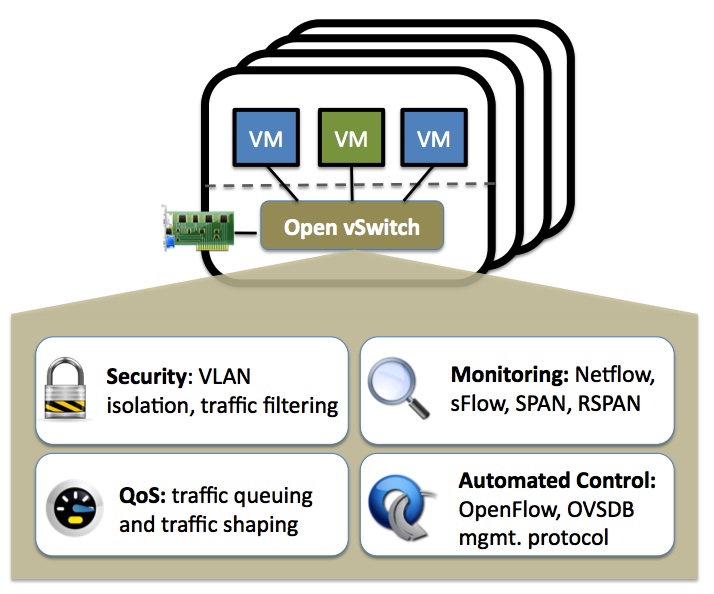
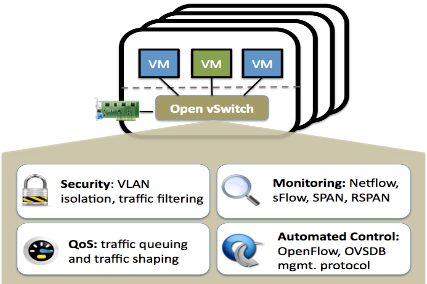
OpenVswitch is a production-quality Multi-Layer Virtual switch. It is capable of the following features:
Security: VLAN isolation and traffic filtering
Monitoring: Netflow, sFlow, SPAN, RSPAN
QoS: Traffic queuing and traffic shaping
Automated Control: OpenFlow, OVSDB management protocol
In this article, we will be working with the following tooling related to OVS. The following commands will be run as the root user on any of the OCP nodes (control-plane and/or worker).
ovs-appctl- for querying and controlling Open vSwitch daemon
ovs-dpctl- Open vSwitch datapath management utility
ovs-dpctl-top- Top like behavior for ovs-dpctl dump-flows output
ovs-ofctl- OpenFlow switch management utility
ovs-vsctl- ovs-vswitchd management utility
The following image was taken from:
https://github.com/openshift/ovn-kubernetes/blob/master/README_MANUAL.md
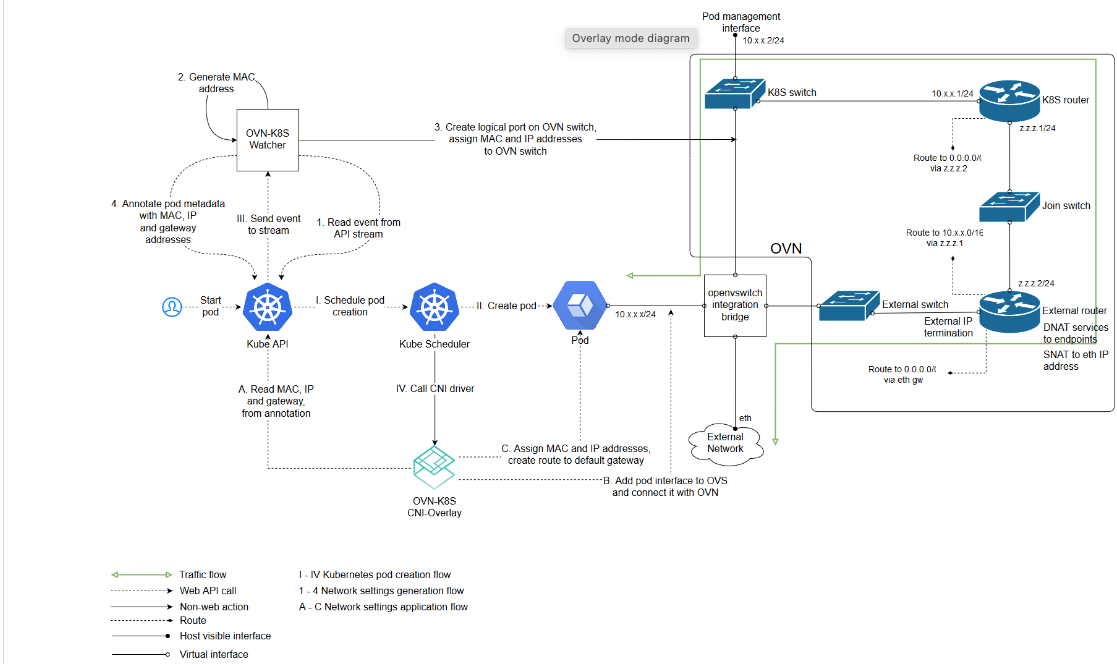
In this article, we won't deal as much with how mac addresses and/or IP addresses are assigned to pods and how the associated ports are instantiated in the OVS/OVN configuration. I mostly want to show the result of these operations on a running cluster. Traffic flow, viewing the OpenVswitch/OVN configurations, and how to use the tooling are the main concepts that I wanted to cover.
On my first master server (master1), I am going to run the following command:
ovs-vsctl showSome abbreviated output is shown below.
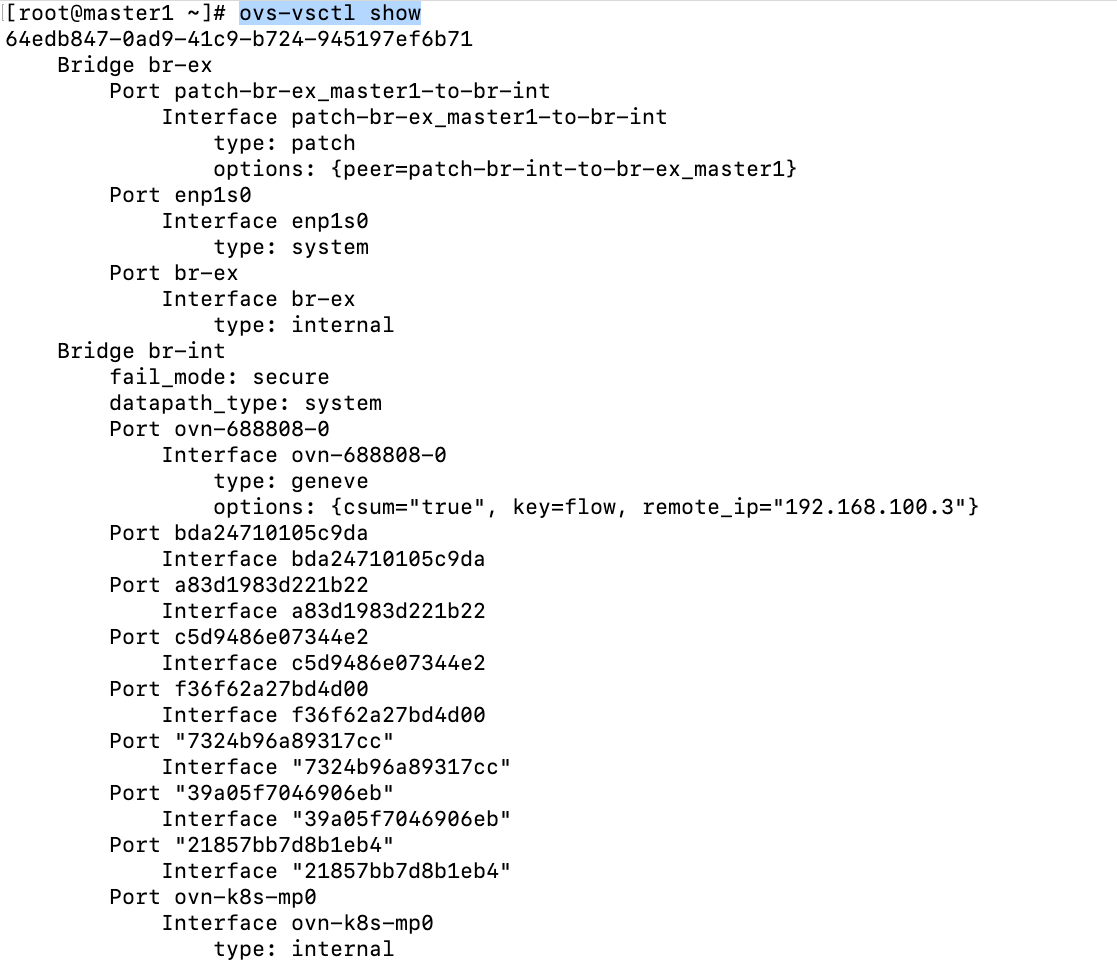
The full output of this command will be shown on my Git repo
 kcalliga
There are two bridges/switches defined in OpenVswitch. There is more detail to these descriptions but I'm trying to keep things simple at the moment.
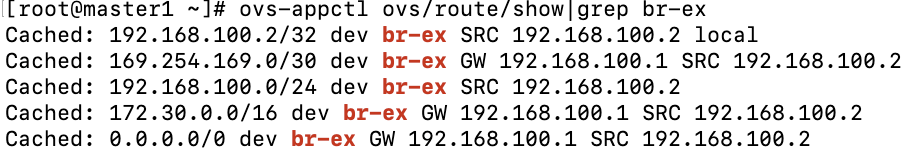
br-ex (bridge/switch)- is the gateway for any network traffic that is needs to go outside of the cluster. The only exception to this is the VIPs that host Openshift/Kubernetes services.
br-int- is the bridge that handles any pod traffic whether it is inter or intra-node.
Some of the ports that are defined on these bridges are as follows:
patch-br-ex-master1-to-br-int- this is on the br-ex bridge and takes traffic from outside of the cluster and from service IPs and connects to the br-int bridge/switch.
br-ex (port)- This is the interface name on the br-ex bridge/switch that handles traffic that goes out of the OCP cluster. Here is some sample output showing some of the route destinations that traverse this path.
ovn-k8s-mp0- This is the connection to the OVN overlay network and is located on the br-int bridge/switch. Packets destined to any of the pod networks whether the pod is local to the node or not will start here.
For this demonstration, we will look at the path that packets take when going from a pod on master1 to a pod that is on master2.
My master1 server currently has pods assigned in the 10.129.0.0/23 network. Master2 is assigned from the 10.128.0.0/23 network.
From master1, run the following command:
ovs-appctl ovs/route/lookup 10.128.0.1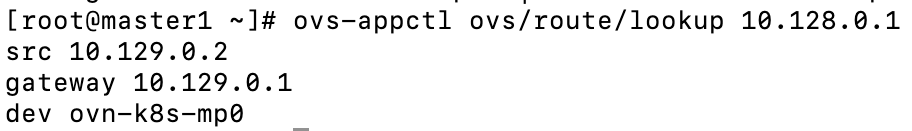
Notice that the traffic uses the ovn-k8s-mp0 to go out. The Geneve tunnel port/interface that goes to master2 is used to tunnel this traffic next.
10.129.0.2 in this example is a switch on the master1 node. 10.129.0.1 is the other side of this link and is a router that is defined in OVN.
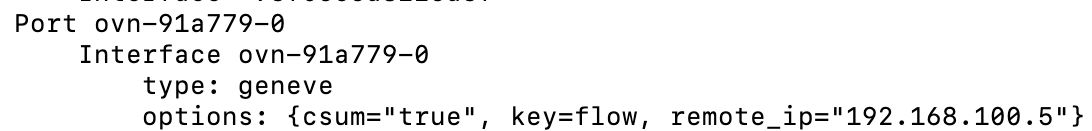
ovn-<randomid>- This is the Geneve tunnel that is traversed when pod traffic needs to go from one OCP node to another. For example, the example shown earlier with regards to master1 needing to send traffic to a pod on master2.
See the screenshot below (taken from ovs-vsctl show output)
Let's now dive into some commands that are useful. Some of these were covered already.
ovs-appctl- Some of the subcommands associated with ovs-appctl are based on other tooling. For example, "ovs-appctl dpctl/list-commands" subcommands are mostly the same as ovs-dpctl.
# Shows commands that are available
ovs-appctl list-commands
# Shows the datapath port information
ovs-appctl dpctl/show
# Assuming you know port information from the previous command
ovs-appctl dpctl/dump-flows|grep "port (5)"
# Show tunnels
ovs-appctl ofproto/list-tunnels
# Show routing table
ovs-appctl ovs/route/show
# Show route to specific destinatino
ovs/route/lookup <ip address>
#Trace flows
ovs-appctl ofproto/trace
#Logging subsystem
ovs-appctl vlog
ovs-ofctl
# Show OpenVswitch ports and description info
ovs-ofctl dump-ports-desc <br-int/br-ex>
# Shows same as above in slightly different format
ovs-ofctl dump-ports <br-int/br-ex>
ovs-vsctl
# Show port mappings
ovs-vsctl show
# Show interfaces/ports on bridge/switch
ovs-vsctl list-ifaces <br-int/br-ex>
ovs-dpctl/ovs-dpctl-top
# Shows basic info on all datapaths
ovs-dpctl show
# Shows single datapath (system@ovs-system)
ovs-dpctl dump-dps
# Show recent flow related to spefic pod IP
ovs-dpctl dump-flows|grep 10.129.0.15
#to run as a script:
ovs-dpctl dump-flows > dump-flows.log
# Top command shows high useage flows and can be sorted
ovs-dpctl-top (use f key to sort through different fields)
# This uses previously created dump file and display top information
ovs-dpctl--script --flow-file dump-flows.log
# Connection tracking information
ovs-dpctl dump-conntrack
# More verbose output including ufid
ovs-dpctl dump-flows -m
# Use ufid to get specific flow
ovs-dpctl get-flow ufid:<ufid from previous command>
Here is another link with some of the same additional information.
 262588213843476
Tooling Exercises
- Run the ovs-dpctl-top command and hit the "f" key until FIELDS (ALL) is displayed
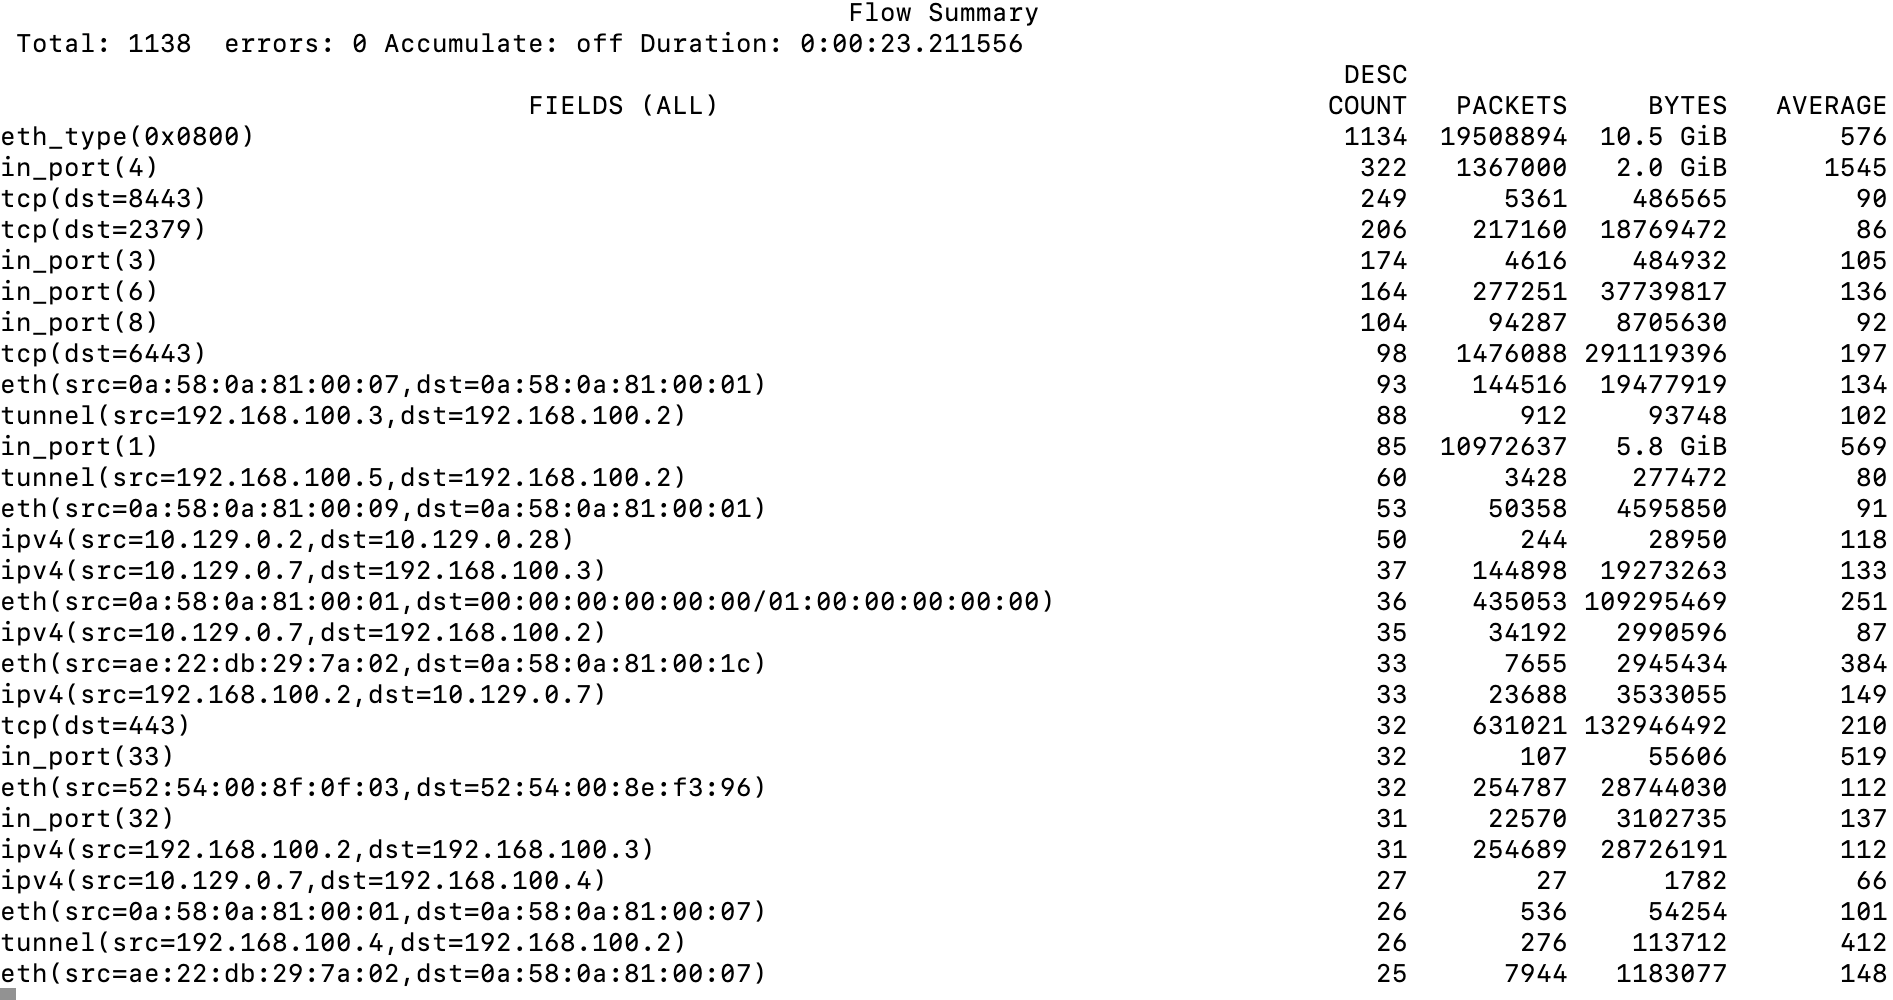
Here is an explanation of some of the information that is displayed
eth_type(0x0800) - This is IPV4 traffic and is 10.5 GB of traffic.
in_port(4)- this corresponds to ovn-k8s-mp0 control-plane. All internal cluster traffic (pod to pod) should traverse this link. 2 GB currently.
tcp(dst=6443)- this corresponds to api traffic.
in_port(1)- this corresponds to traffic coming into the main Ethernet device (enp1s0).
2. Let's dump some output showing any request that is going to the 172.30.0.10 IP (Cluster DNS)
ovs-dpctl dump-flows|grep 172.30.0.10
From this output, we can see that the traffic originated from port_19 (in_port=19) and the IP address of the pod is 10.129.0.19.
To use OCP tooling to find the pod that is associated with IP 10.129.0.19, run the following command:
oc get po -o wide -A|grep 10.129.0.19
From this output, we can see that the pod is in the openshift-authentication-operator namespace/project, running on master1.
If we didn't have access to the cluster, there is another way to get this information using the crictl command from master1.
for containerid in `crictl ps -a|awk '{print $1}'`; do echo $containerid; crictl inspect $containerid|grep 10.129.0.19; doneThe output may be verbose but I see what I want in the output. In this output, we can see that the containerid is d4e3e12ea2a79.

Now, run the following:
crictl ps -a|grep d4e3e12ea2a79
The containername is authentication-operator
3. Based on exercise 2, run an inspect against this container (d4e3e12ea2a79) and find the net namespace for this container.
crictl inspect d4e3e12ea2a79Output abbreviated

To enter this net-namespace, run the following command:
nsenter --net=/var/run/netns/7d78ae55-1a80-4615-8c8b-8c3283ed88cType "ip a" to list the mac address and IP information
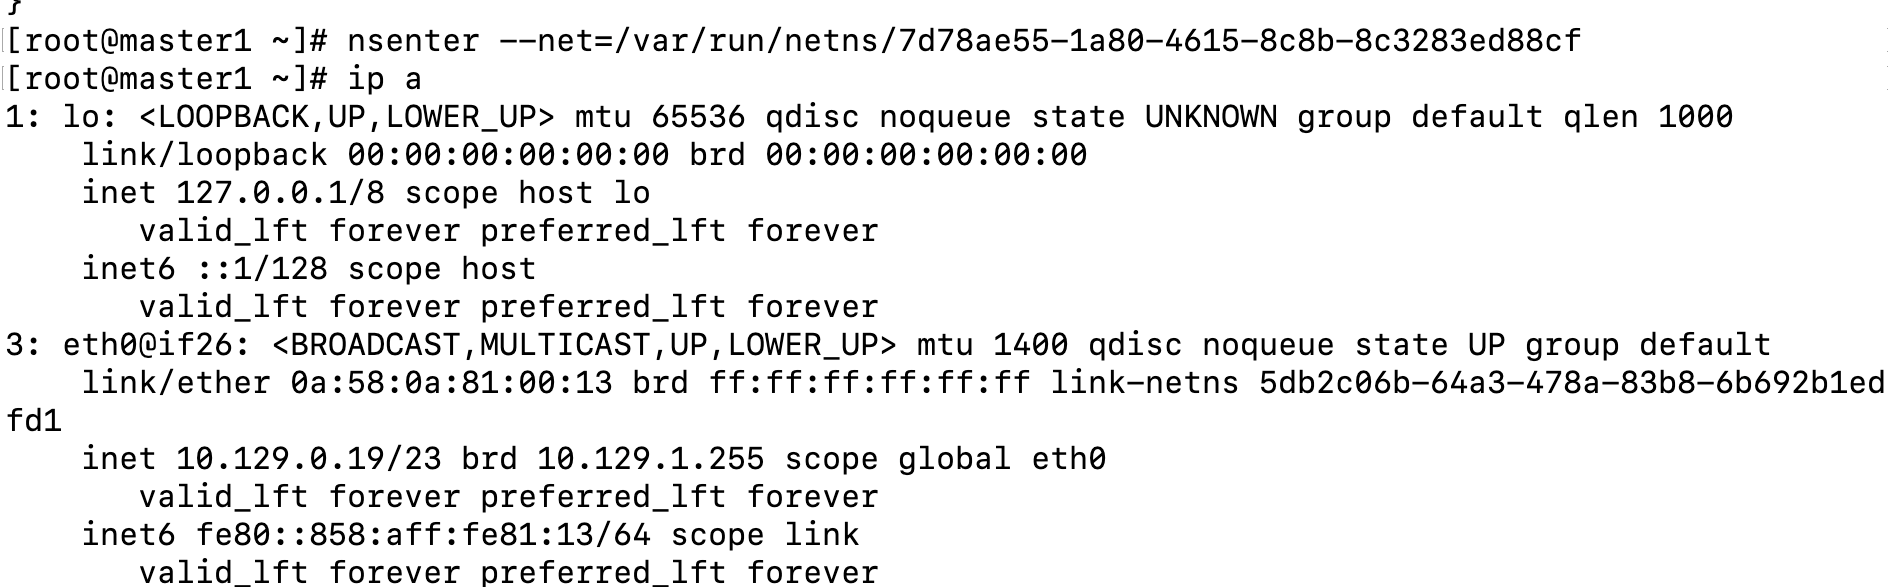
Type "exit" to get out of this net-namespace
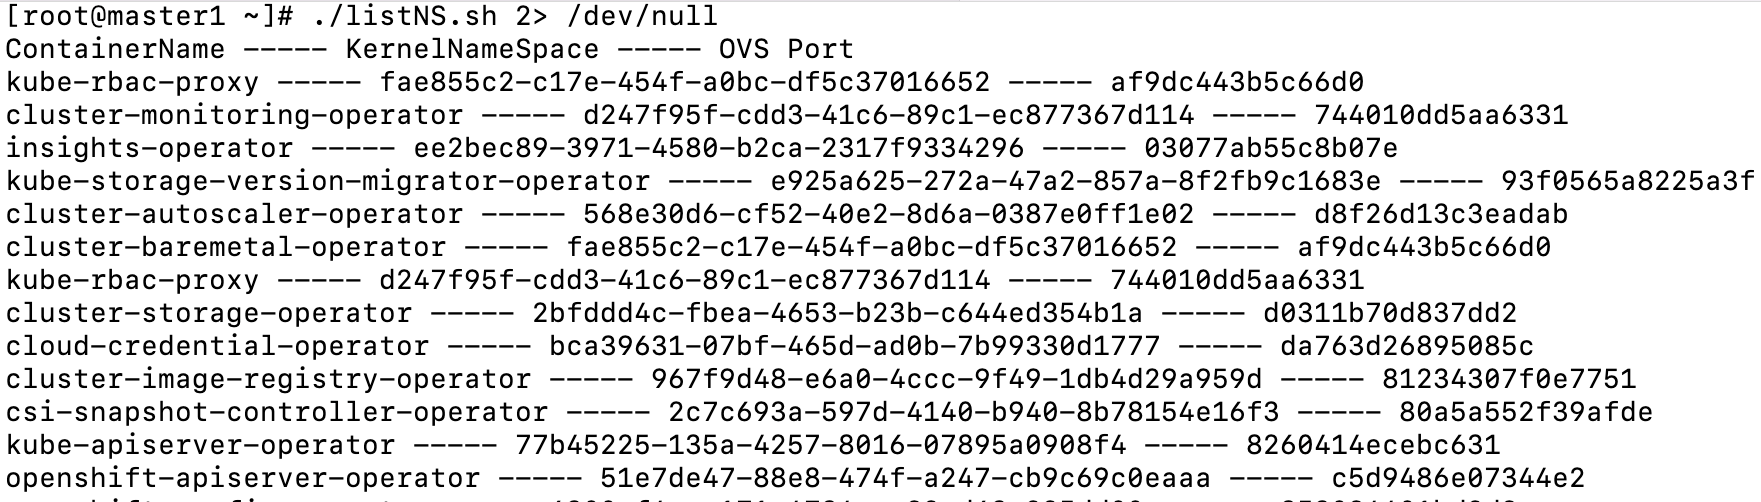
4. I made the following script which takes some complexity out of mapping container name to the kernel-namespace that it runs in and also the associated OVS port. This script will help with that.
#! /bin/bash

# This script uses the crictl command to do an inspection of a container and returns a list of the name of the container and the net na
mespace that it is in.  This can be useful if you want to run a tcpdump on a container

echo "ContainerName ----- KernelNameSpace ----- OVS Port"
# First let's get a list of all containers running on node that are in a running state and loop through it to get relevant information
for containerid in `crictl ps -a|grep Running|awk '{print $1}'`; do
ContainerName=`crictl ps -a|grep $containerid|awk '{print $7}'`;
KernelNameSpace=`crictl inspect $containerid|grep netns|awk -F "/" '{print $5}'|awk -F "\"" '{print $1}'`;
KernelNameSpaceCount=`crictl inspect $containerid|grep netns|awk -F "/" '{print $5}'|awk -F "\"" '{print $1}'|wc -l`;
OVSPort=`ip link show|grep -B1 $KernelNameSpace|grep ovs-system|awk -F ":" '{print $2}'|awk -F "@" '{print $1}' 2> /dev/null`;
if [ $KernelNameSpaceCount -eq "1" ]; then
echo  $ContainerName ----- $KernelNameSpace ----- $OVSPort;
else
:
fi
done;
Output of script (abbreviated)
Follow-on article on OVN to come next. Hope you enjoyed.