
Gathering Baseline Openshift Usage Information from Metrics
Once an OCP cluster is built, it's a good idea to understand a few pieces of information to properly size the cluster based on the hardware that you are using. These pieces of information should be gathered before any additional/custom workloads are added but can include the base OCP components and OCP operators such as ODF, Quay registry, ACM (Advanced Cluster Management), and ACS (Advanced Cluster Security) if you wish.
By hardware, I mean the number and size/configuration of the nodes (mostly worker nodes unless workloads are also being assigned to master nodes.
One of the first concepts you should understand when measuring resources in Kubernetes/OCP is to understand how CPU power is accounted for. The term that is used when specifying pod resource usage in relation to CPU power is the millicore. Here is a definition of that term.
Millicore - CPU processing power in Kubernetes/OCP is measured in this fashion. 1000 millicores is related to one thread. For example, I have a test server with 4 physical cores/8 threads. OCP detects this server as having 7500 millicores available (a little bit is subtracted for overhead).

Here are some other terms to understand.
CPU Requests- this is the minimum amount of CPU resources (in millicores) that is allocated to a pod/container.
Memory Requests- this is the minimum amount of memory that is allocated to a pod/container.
CPU Limits- this is the maximum amount of CPU resources (in millicores) that are allocated to a pod/container. It is important that this is set to prevent a process from consuming too much CPU which may cause another workload to not schedule or fail.
Memory Limits- this is the minimum amount of memory resources that are allocated to a pod/container. It is important that this is set to prevent a process from consuming too much memory which may cause another workload to not schedule or fail.
Storage - In regards to node-level storage, we need to ensure that enough storage is available to account for ephemeral (non-permanent) storage. This isn't a problem typically but I want to mention it.
Multiple Way to View the Information
OC ADM Top Command
The "oc adm top" command has a few flags that will help us for capacity planning purposes. The pod and node output is very useful. This command shows current utilization.
From the command line, the following commands can be run
oc adm top nodes
-From this output, we can see that I am running a SNO cluster (single-node).
-I am using 1200 millicores (1.2 threads) which is approximately 16 % of my total CPU processing power (total of 8 threads on my node).
-Memory usage is 17.044 GB which is approximately 55% of my total cluster (32GB of RAM)
oc adm top podsThis command (by default) is scoped based on the current namespace/project that you are in.
To run across all namespaces and to do some sorting based on cpu utilization, run the following:
oc adm top pods -A|sort -n +2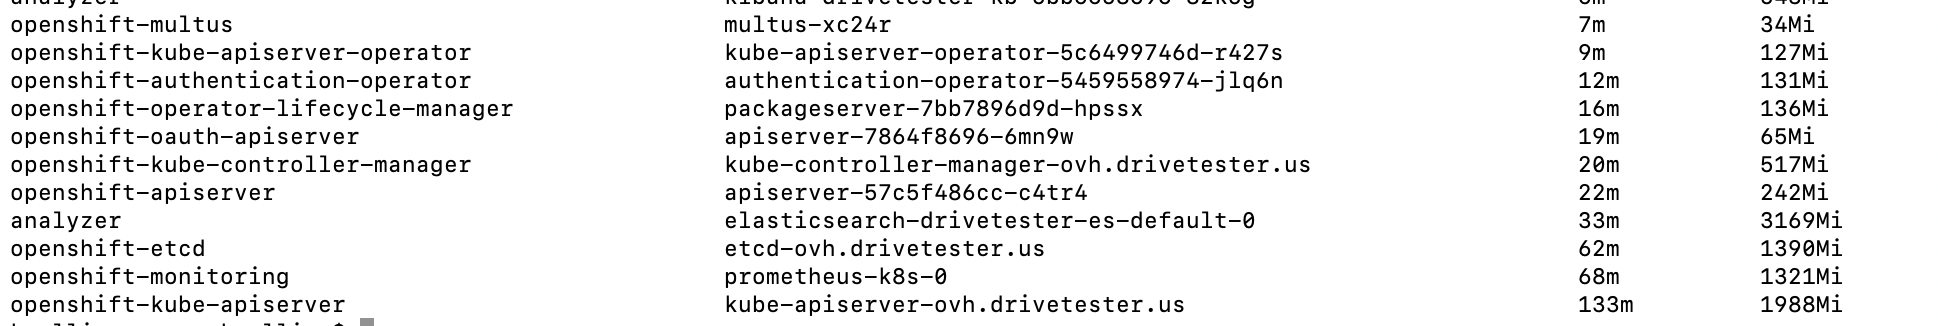
The third column is cpu utilization. The output shows bottom of the list (highest CPU usage among pods in all namespaces/projects)
For example, the kube-apiserver pod is using 133 millicores (.133 threads) currently
To run across all namespaces and to do some sorting based on memory utilization, run the following:
oc adm top pods -A|sort -n +3
The highest usage (by memory) in my environment is an elasticsearch pod that runs as part of my drivetester website. It is using 3.170 GB of memory currently.
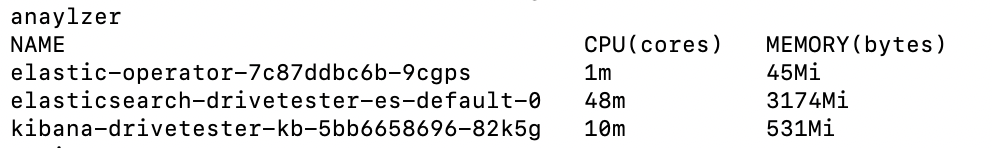
Another neat way to be able to view pods utilization in each namespace would be to run the following command:
for project in `oc get project|grep -v NAME`; do echo $project; oc project $project 2> /dev/null; oc adm top pods; done;This will go to each project and show the usage of all pods in that project. I'm using a project called "analyzer" in this example.
OC Describe Node Command
This command will show some key pieces of information at the node-level. Here is some relevant output based on the "oc describe node <nodename>" command.
I will break this down into the different sections and explain
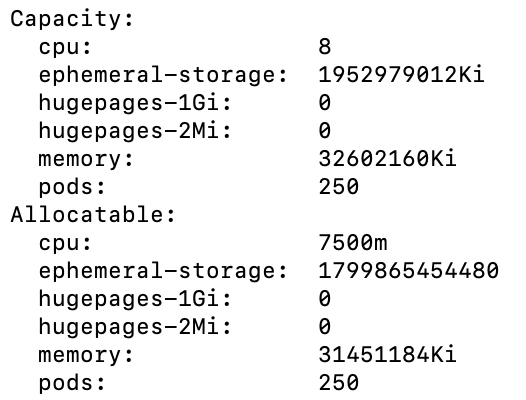
In the capacity section:
-The total amount of CPU power is 8 threads
-The amount of ephemeral storage (/var/lib/storage/containers) is approximately 195GB
-Huge-pages is not enabled
-Total memory is 32GB on the node
- The maximum number of pods that are allowed to run by default on the node is 250. Changing this is possible but out of scope for this document
In the allocatable section:
This is the same concept but there is a little overhead that is subtracted based on some system processes (mostly kubelet) that run on the node.
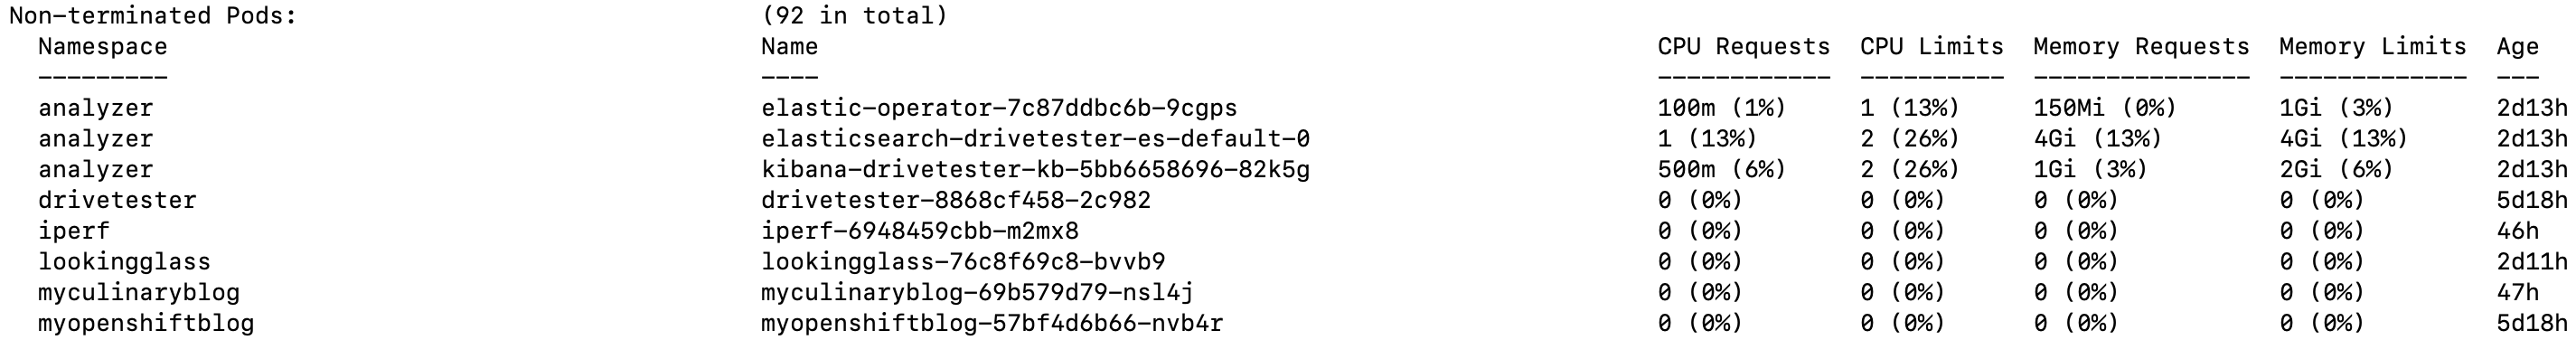
This output shows the pods that are running on the node and lists the cpu/memory request/limit information.
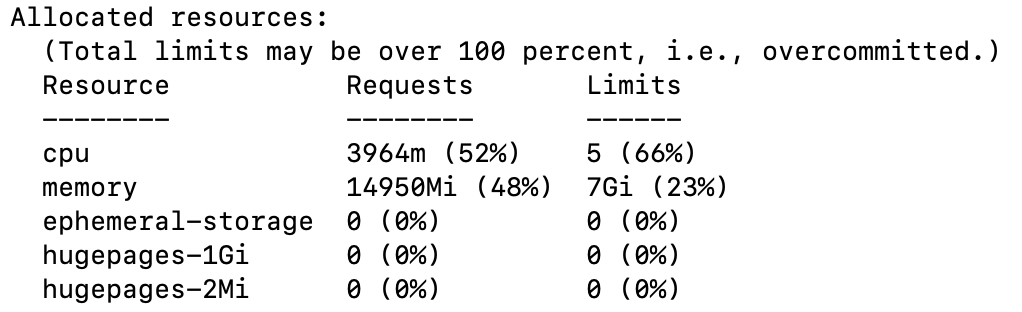
This is another view of similar information but based on the total node data
Grafana
On the Openshift Web Console, go to "Observe --> Dashboards" menu.
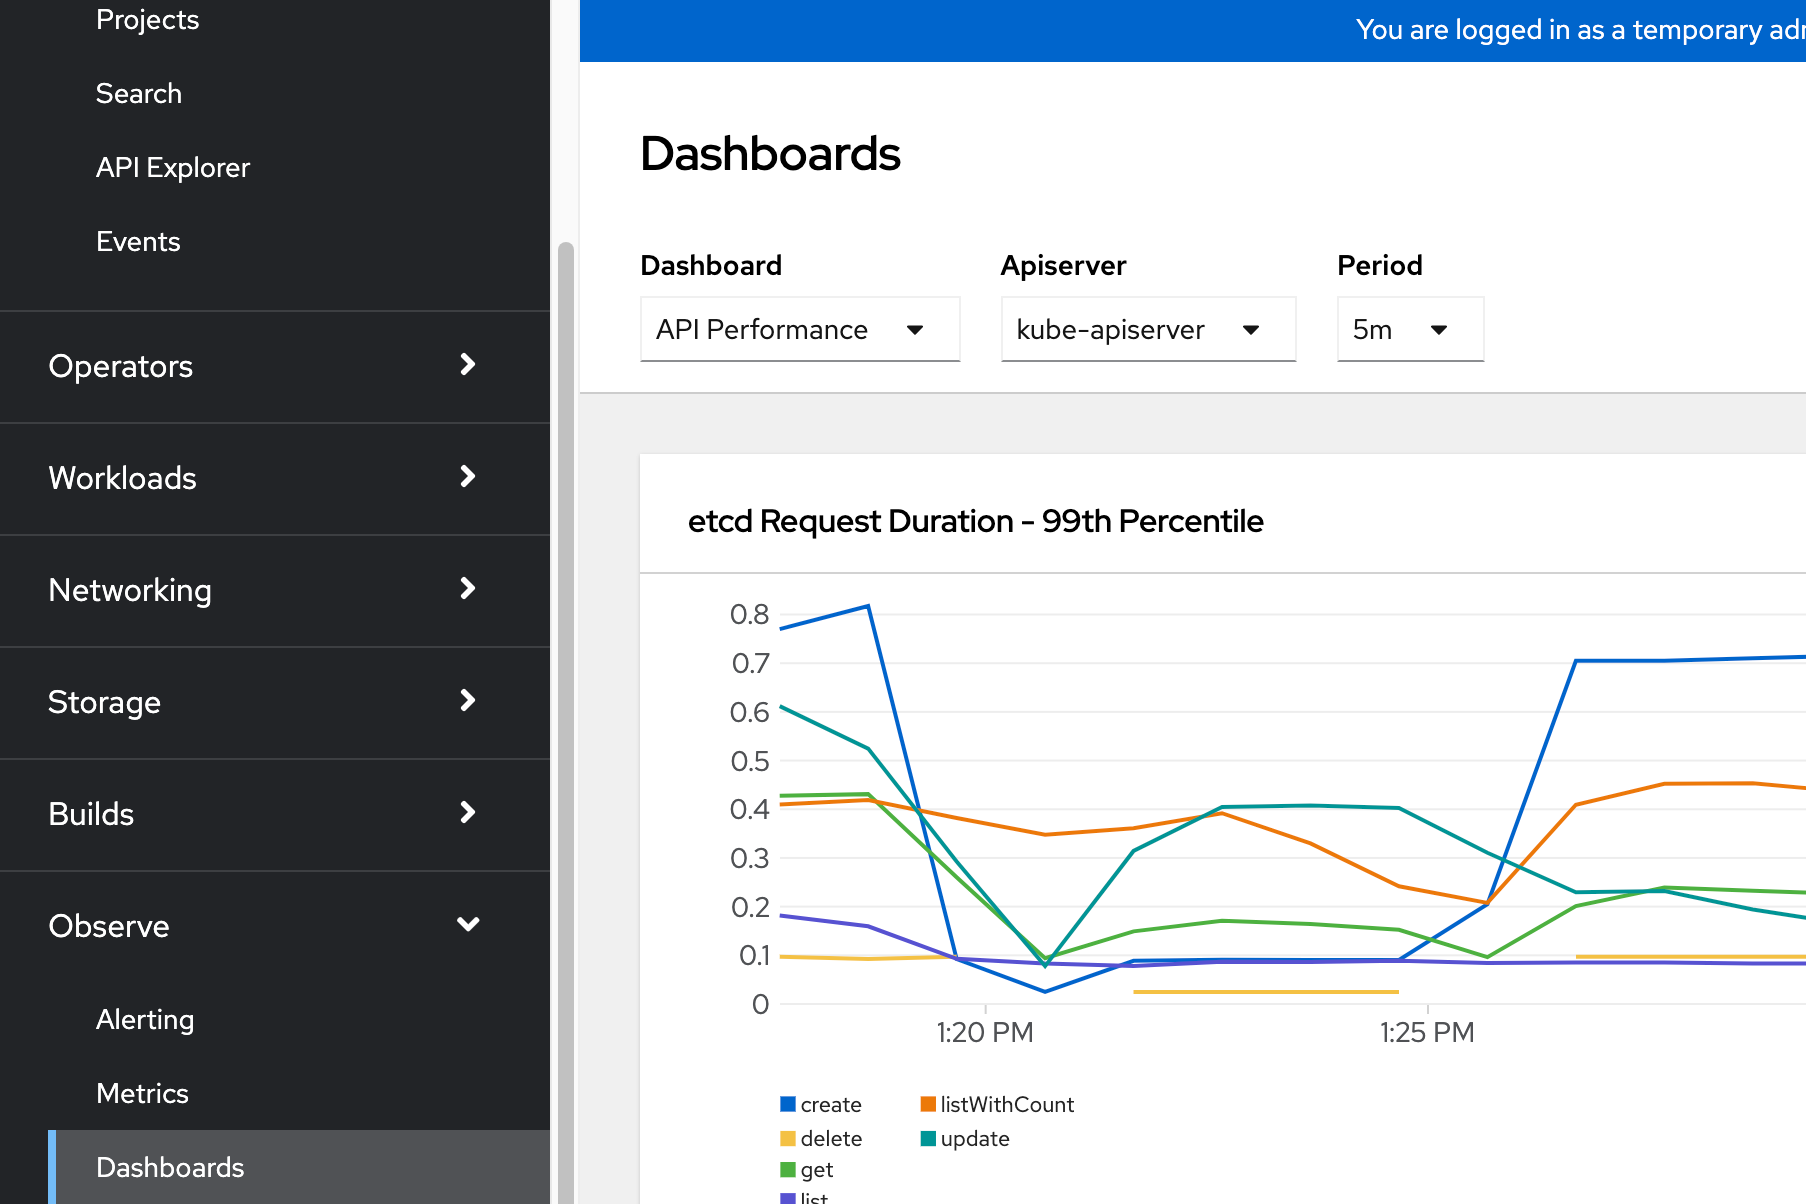
There are a bunch of default dashboards that will show the information that we will need.
For dashboard (middle of the screen), select Kubernetes/Compute Resources/Cluster
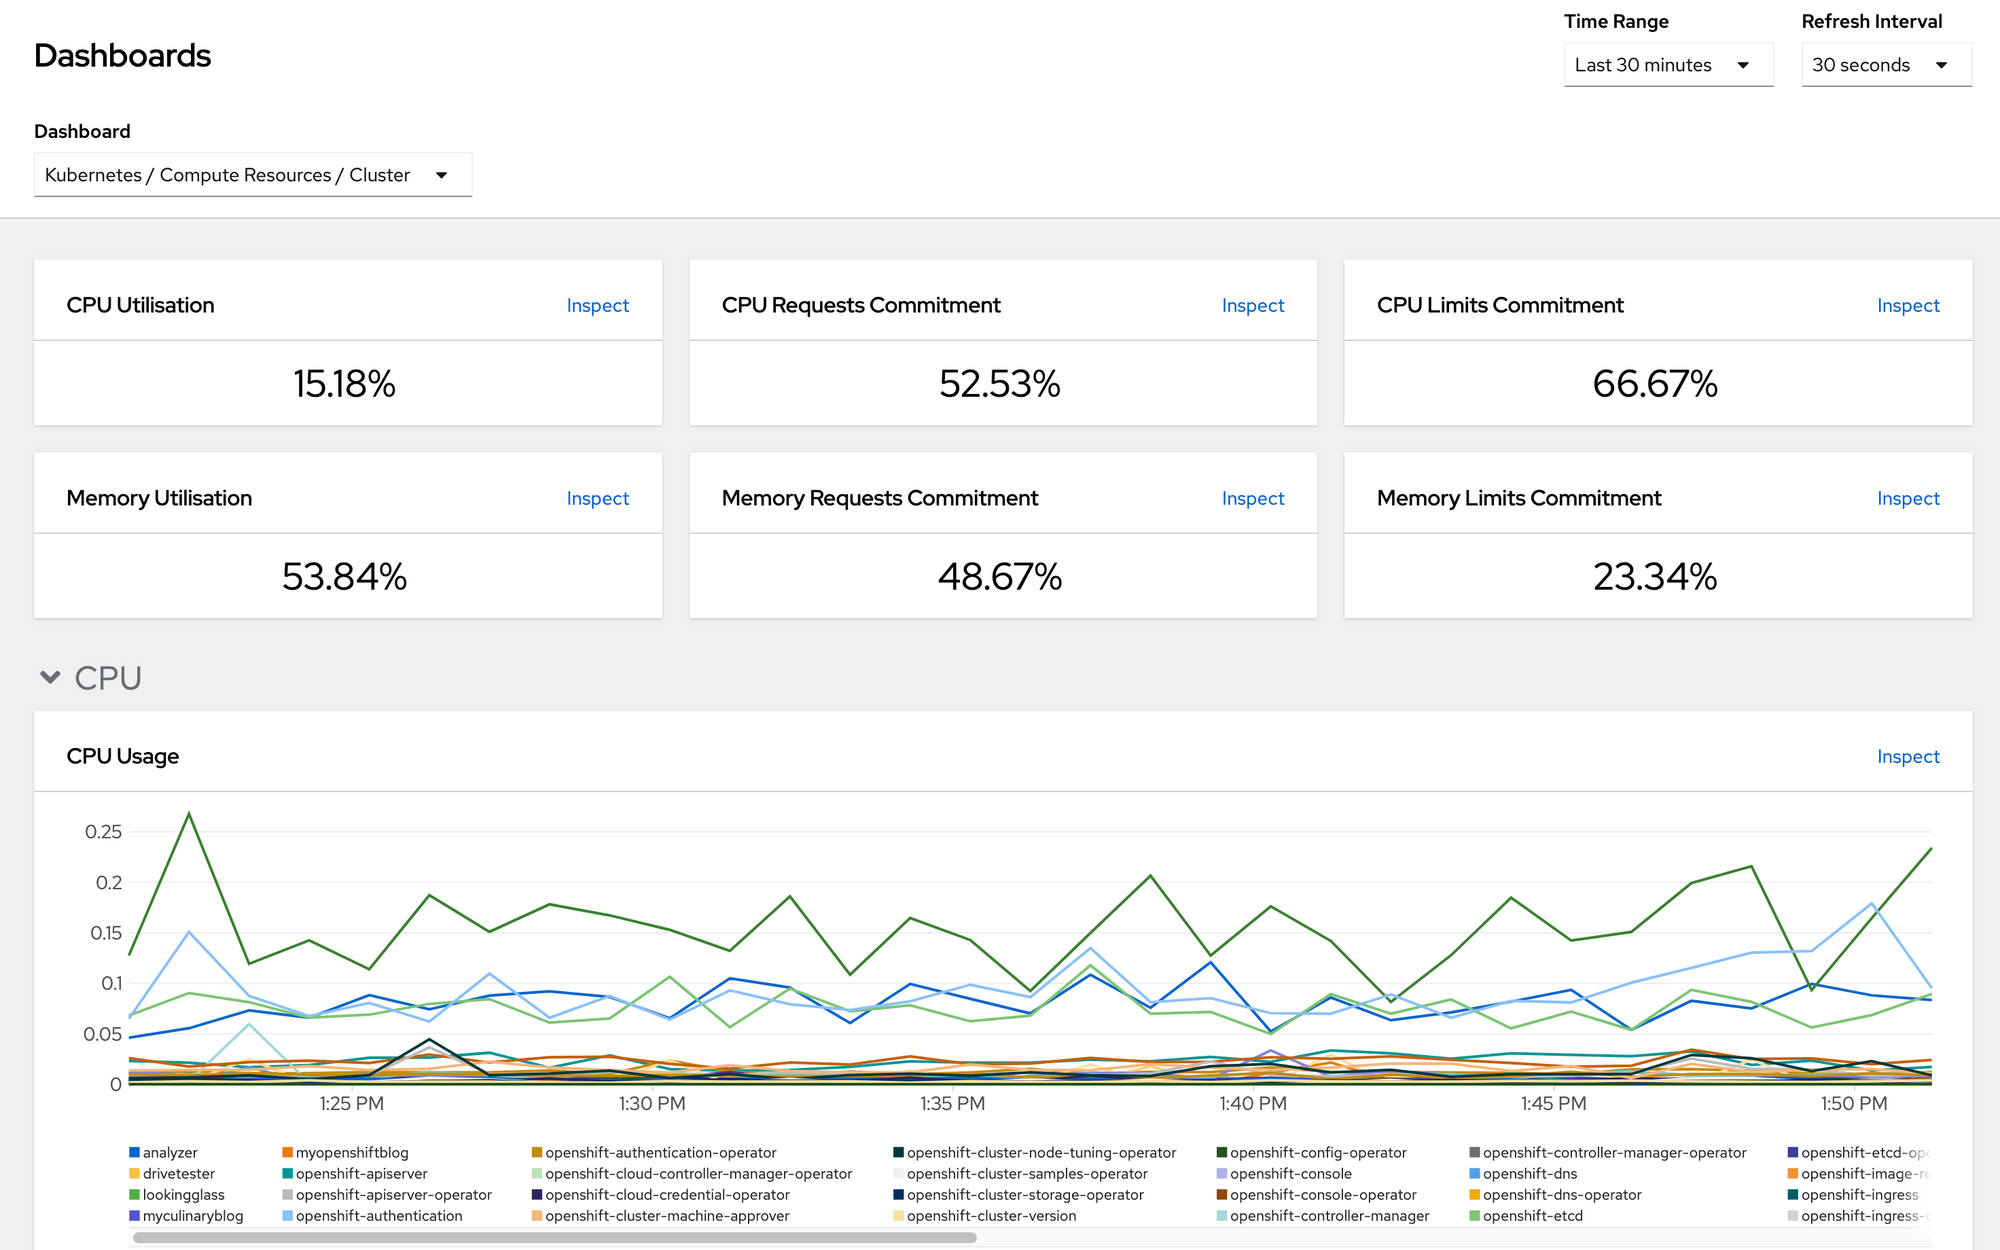
The top of the screen shows a wealth of information at the cluster-wide level.
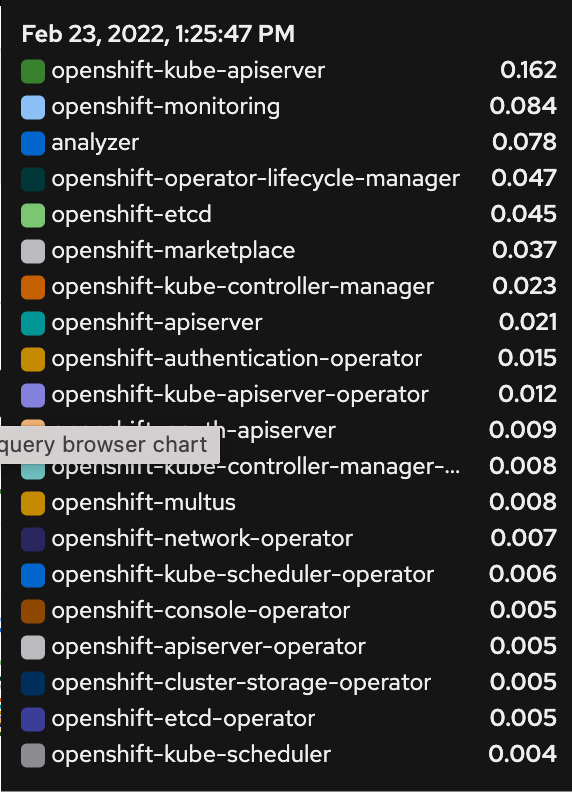
Under the CPU section, you can hover over the chart to see a breakdown of cpu usage by project
There are other dashboards that will show a similar graph at the node-level and also to view data at a per-namespace level.
Prometheus
Openshift includes built-in queries that can be run to visualize the output of the metrics in yet another way.
On the Openshift Web Console, go to "Observe --> Metrics" menu.
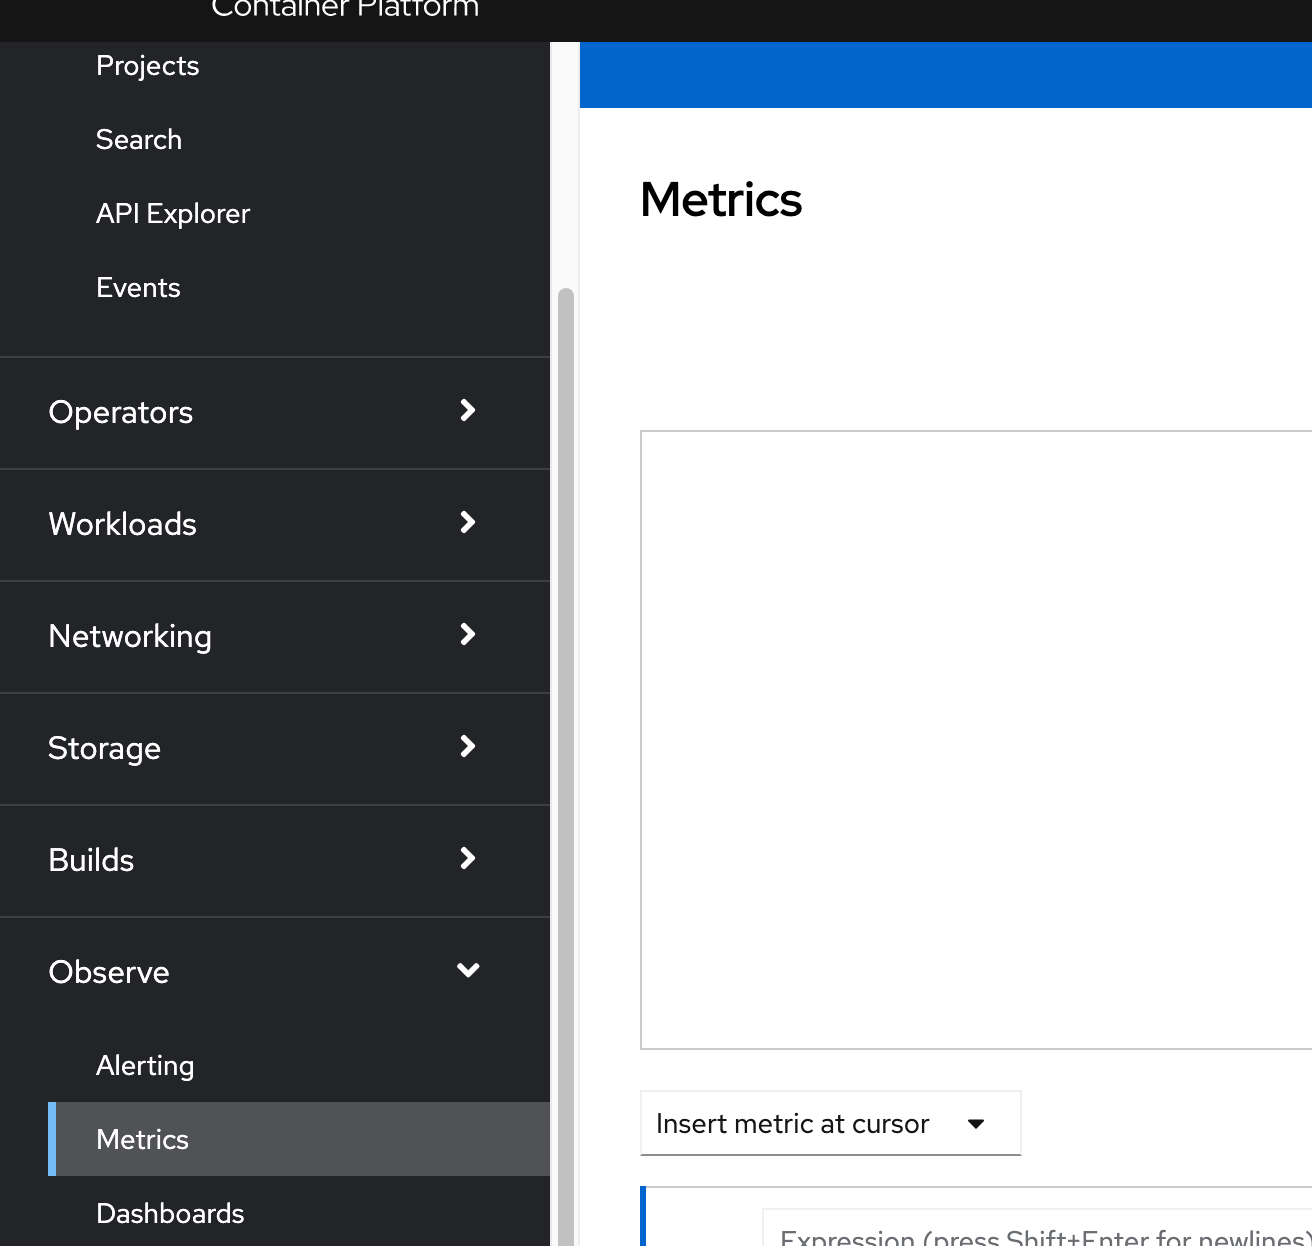
The drop-down menu called "insert metric at cursor" has many queries pre-populated
For demonstration purposes, this demo is only looking at memory and cpu data. The drop down menu allows the user to search for queries that match a keyword.
For example, let's type "memory"
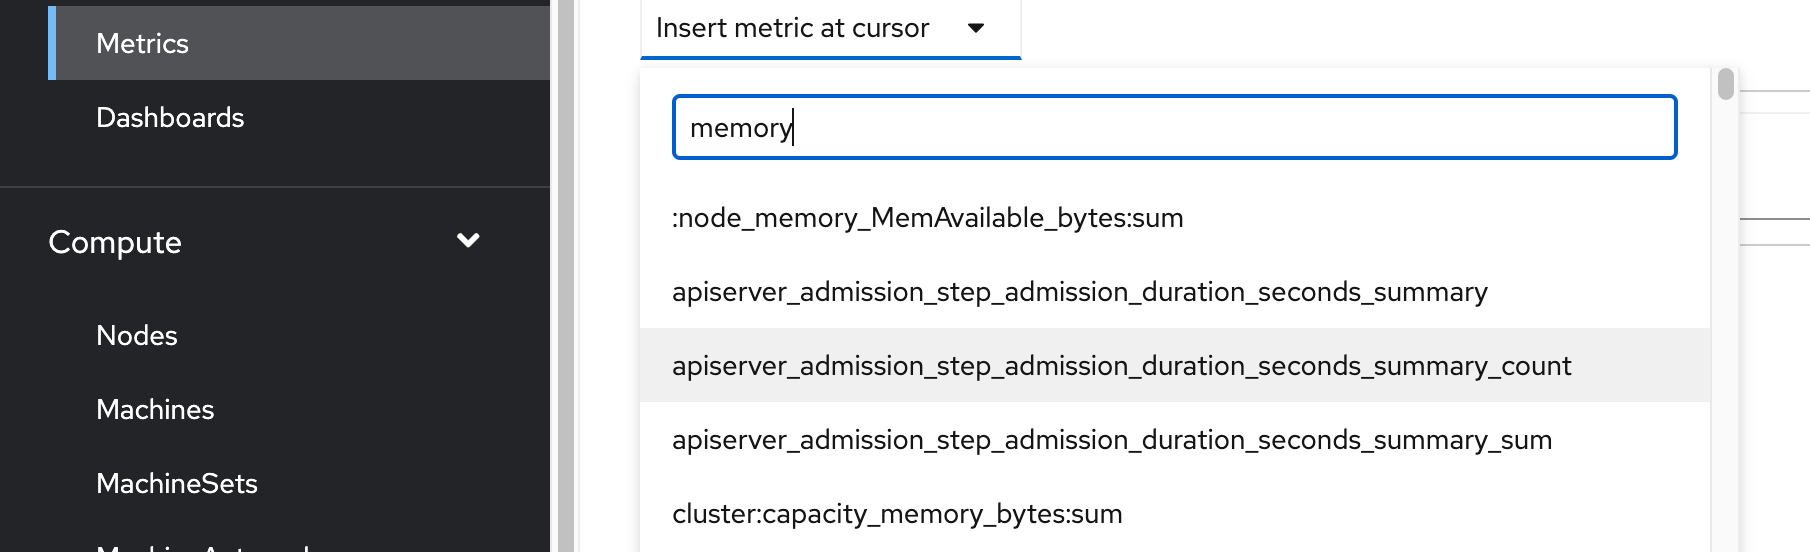
This will will show all of the different queries that can be run based on that keyword. For this example, let's use the following:
namespace:container_memory_usage_bytes:sum
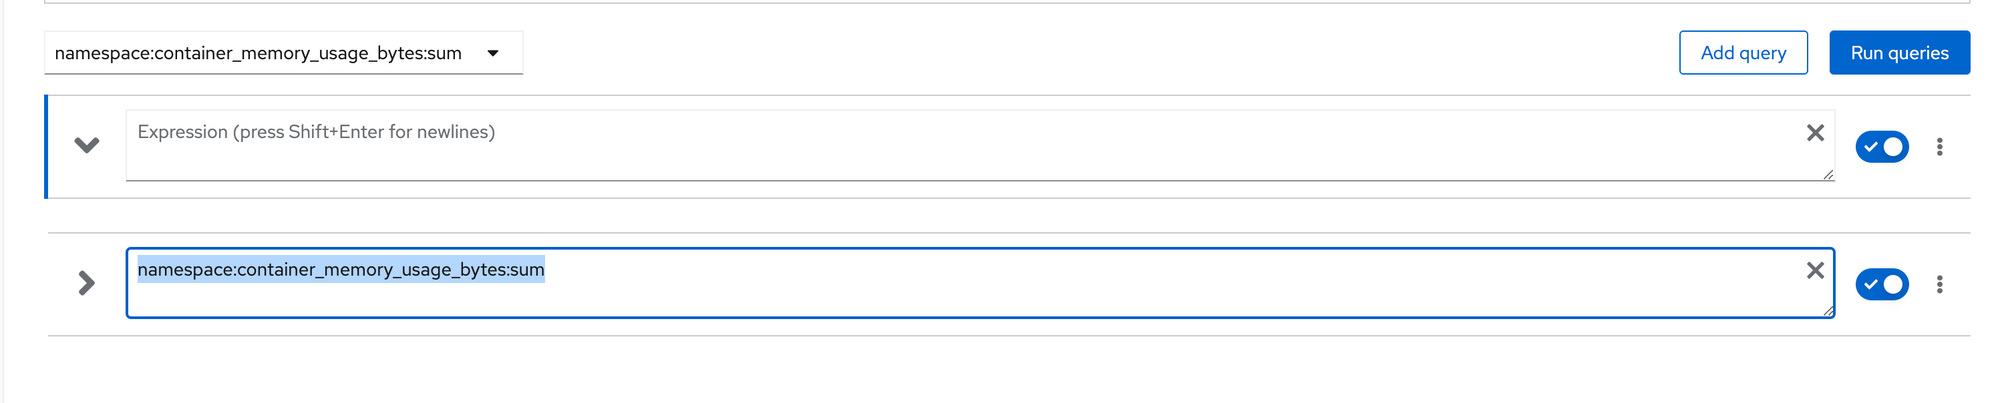
This query can be added to the window for frequent use or you can just run the query.
Let's just run the query for now
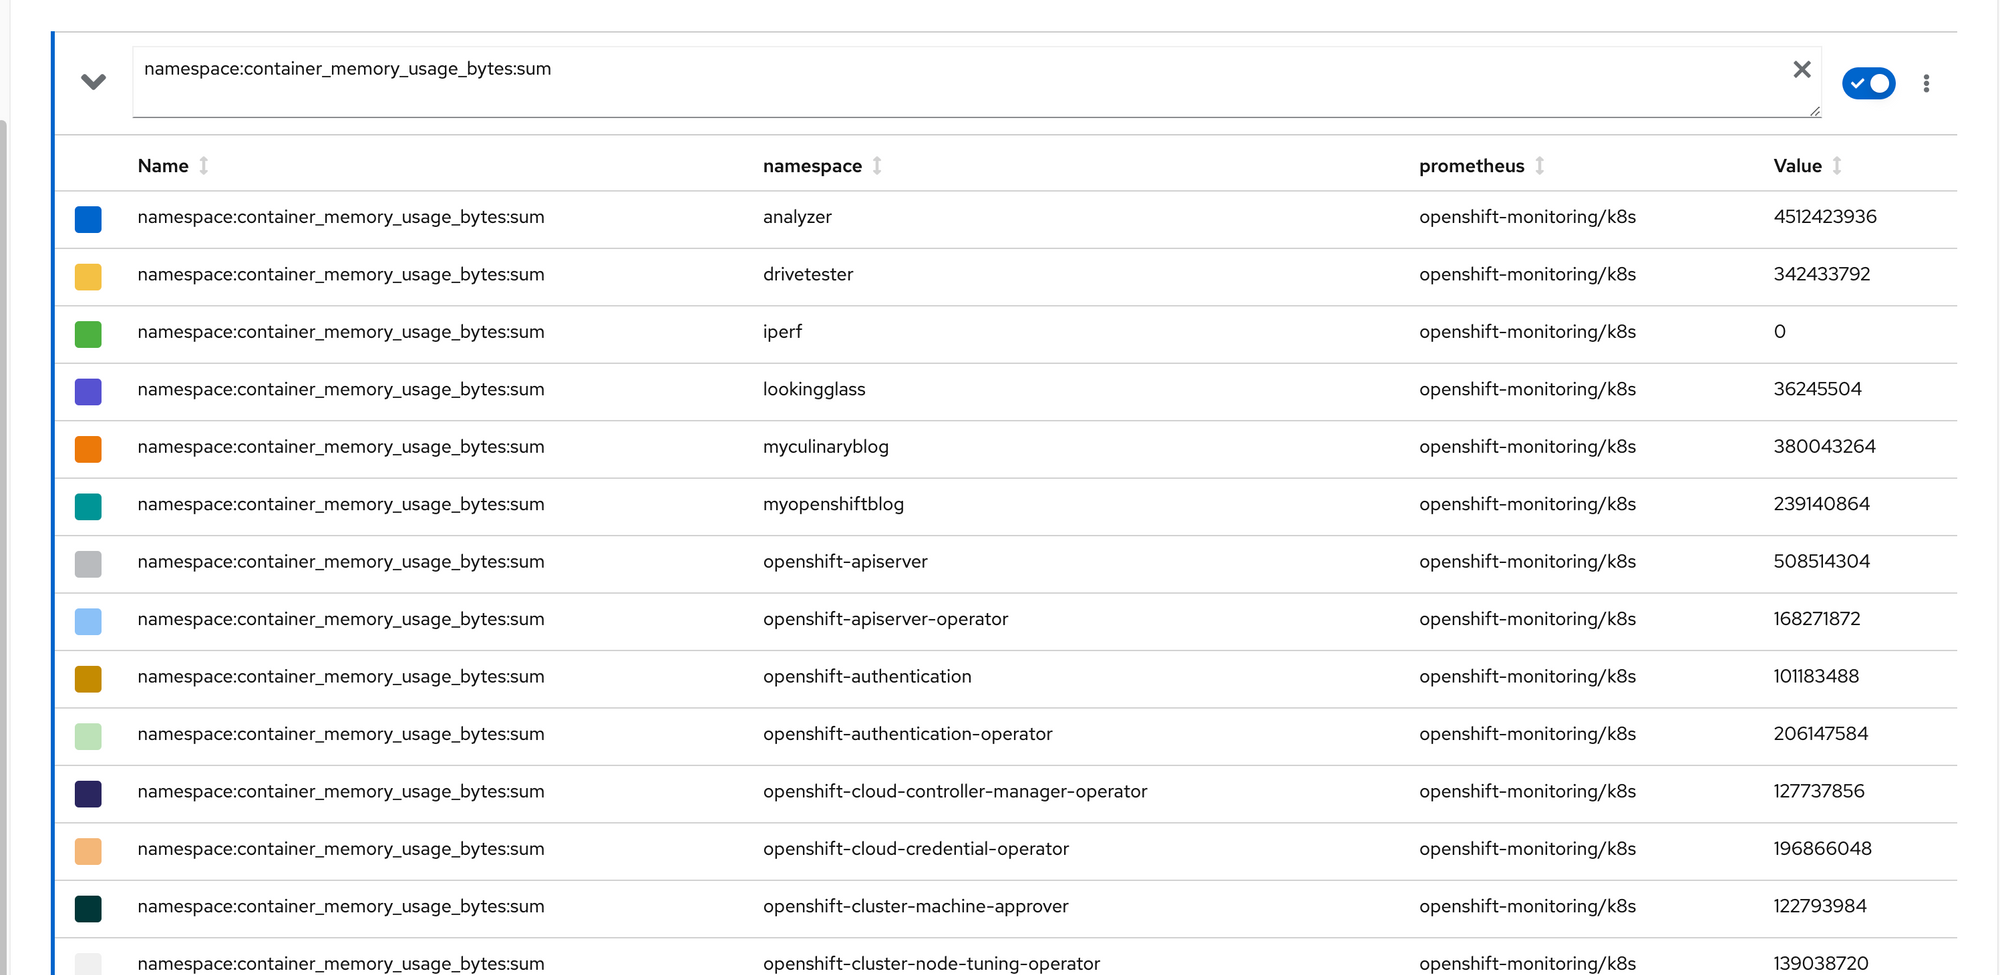
This will present the output by namespace in a table-like view
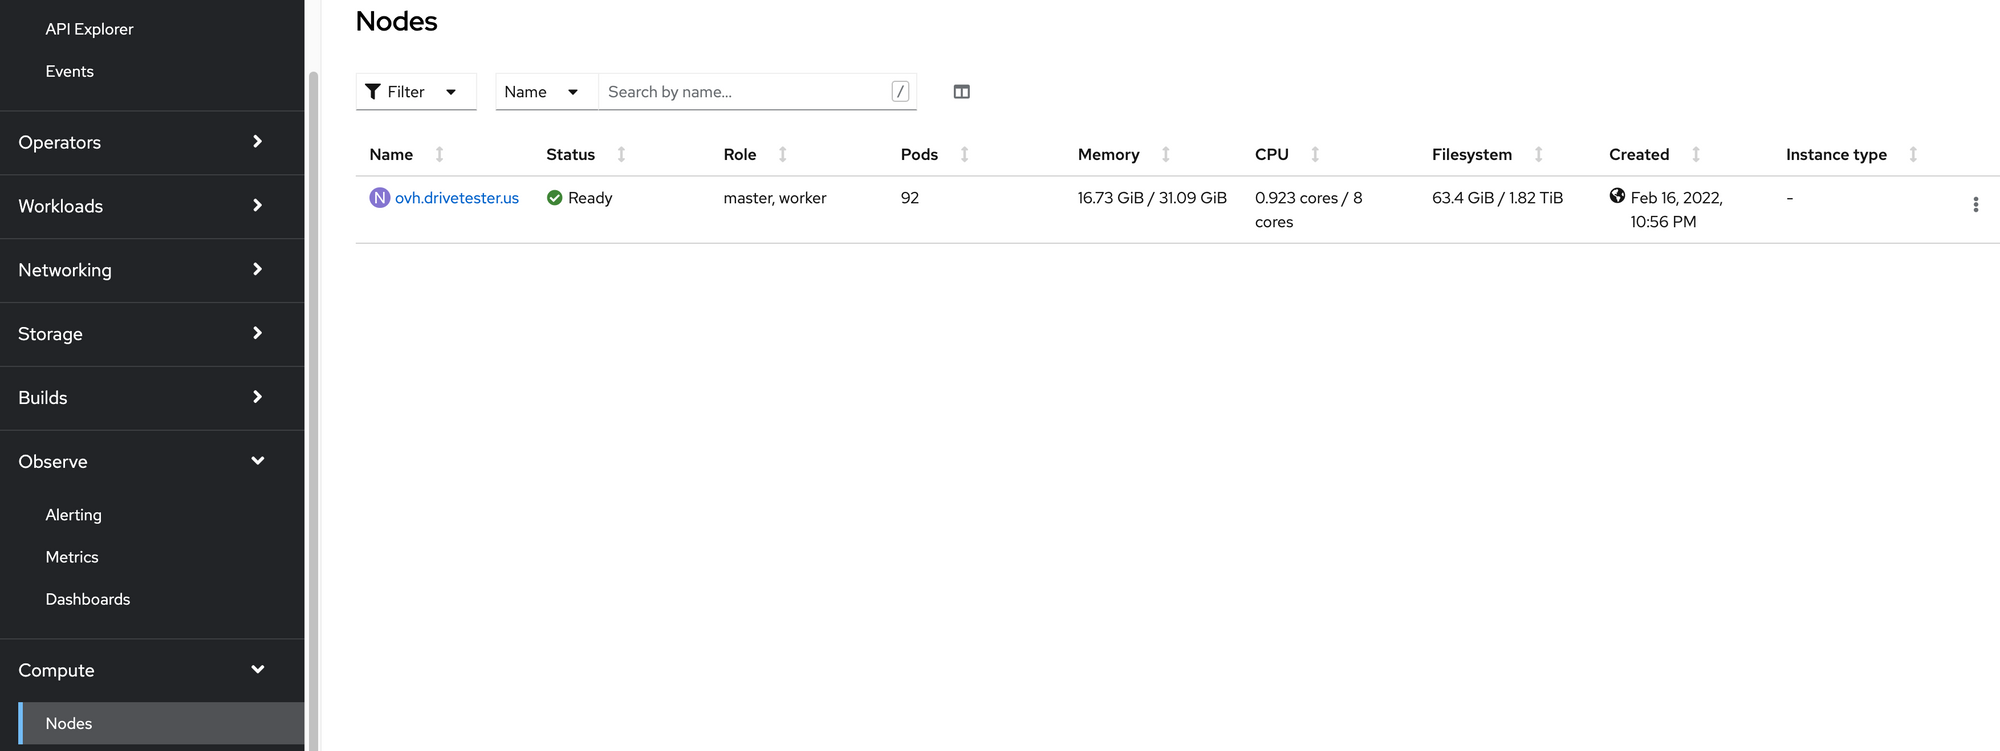
Compute--> Nodes
On the web console, under "Compute --> Nodes" is a high-level view of the resource utilization of each node. This is similar to the output we see in "oc adm top nodes"
In times when a node is oversubscribed (either based on current utilization or limits too high), clicking on the node-name in this screen will show a breakdown on the pods which are causing this issue.
Putting Everything Together
On my cluster, I have a few different workloads running in addition to the base-OCP. Also, this is only a single-node (SNO install).
If I wanted to calculate specific information on memory and CPU for only OCP base components (including any operators that are needed), I would use a combination of the processes discussed previously.
The namespaces for most base OCP components contain "openshift" in the name. Some exceptions are the default namespace and anything that start with kube.
To present this in a nice Spreadsheet-like report, I would want the following information to calculate the resources that are available to run any custom-workloads.
Current Utilization for Memory/Cpu
Memory/CPU Requests
Memory/CPU Limits
Since this is single-node cluster, I could just look at the current utilization and subtract this from the total resources that are available on the node. The bad thing about this is the fact that it doesn't account for workloads/pods that can increase in memory/cpu utilization up to any limits that are set.
I use a combination of these methods to put info into a spreadsheet.
Here is how I performed this action. It is a little messy but a good exercise.
The Prometheus query was used to gather all information
To get the information that was needed, the following queries were used:
namespace:container_memory_usage_bytes:sum
namespace_memory:kube_pod_container_resource_limits:sum
namespace_memory:kube_pod_container_resource_requests:sum
namespace:container_cpu_usage:sum
namespace_memory:kube_cpu_container_resource_limits:sum
namespace_memory:kube_cpu_container_resource_requests:sum
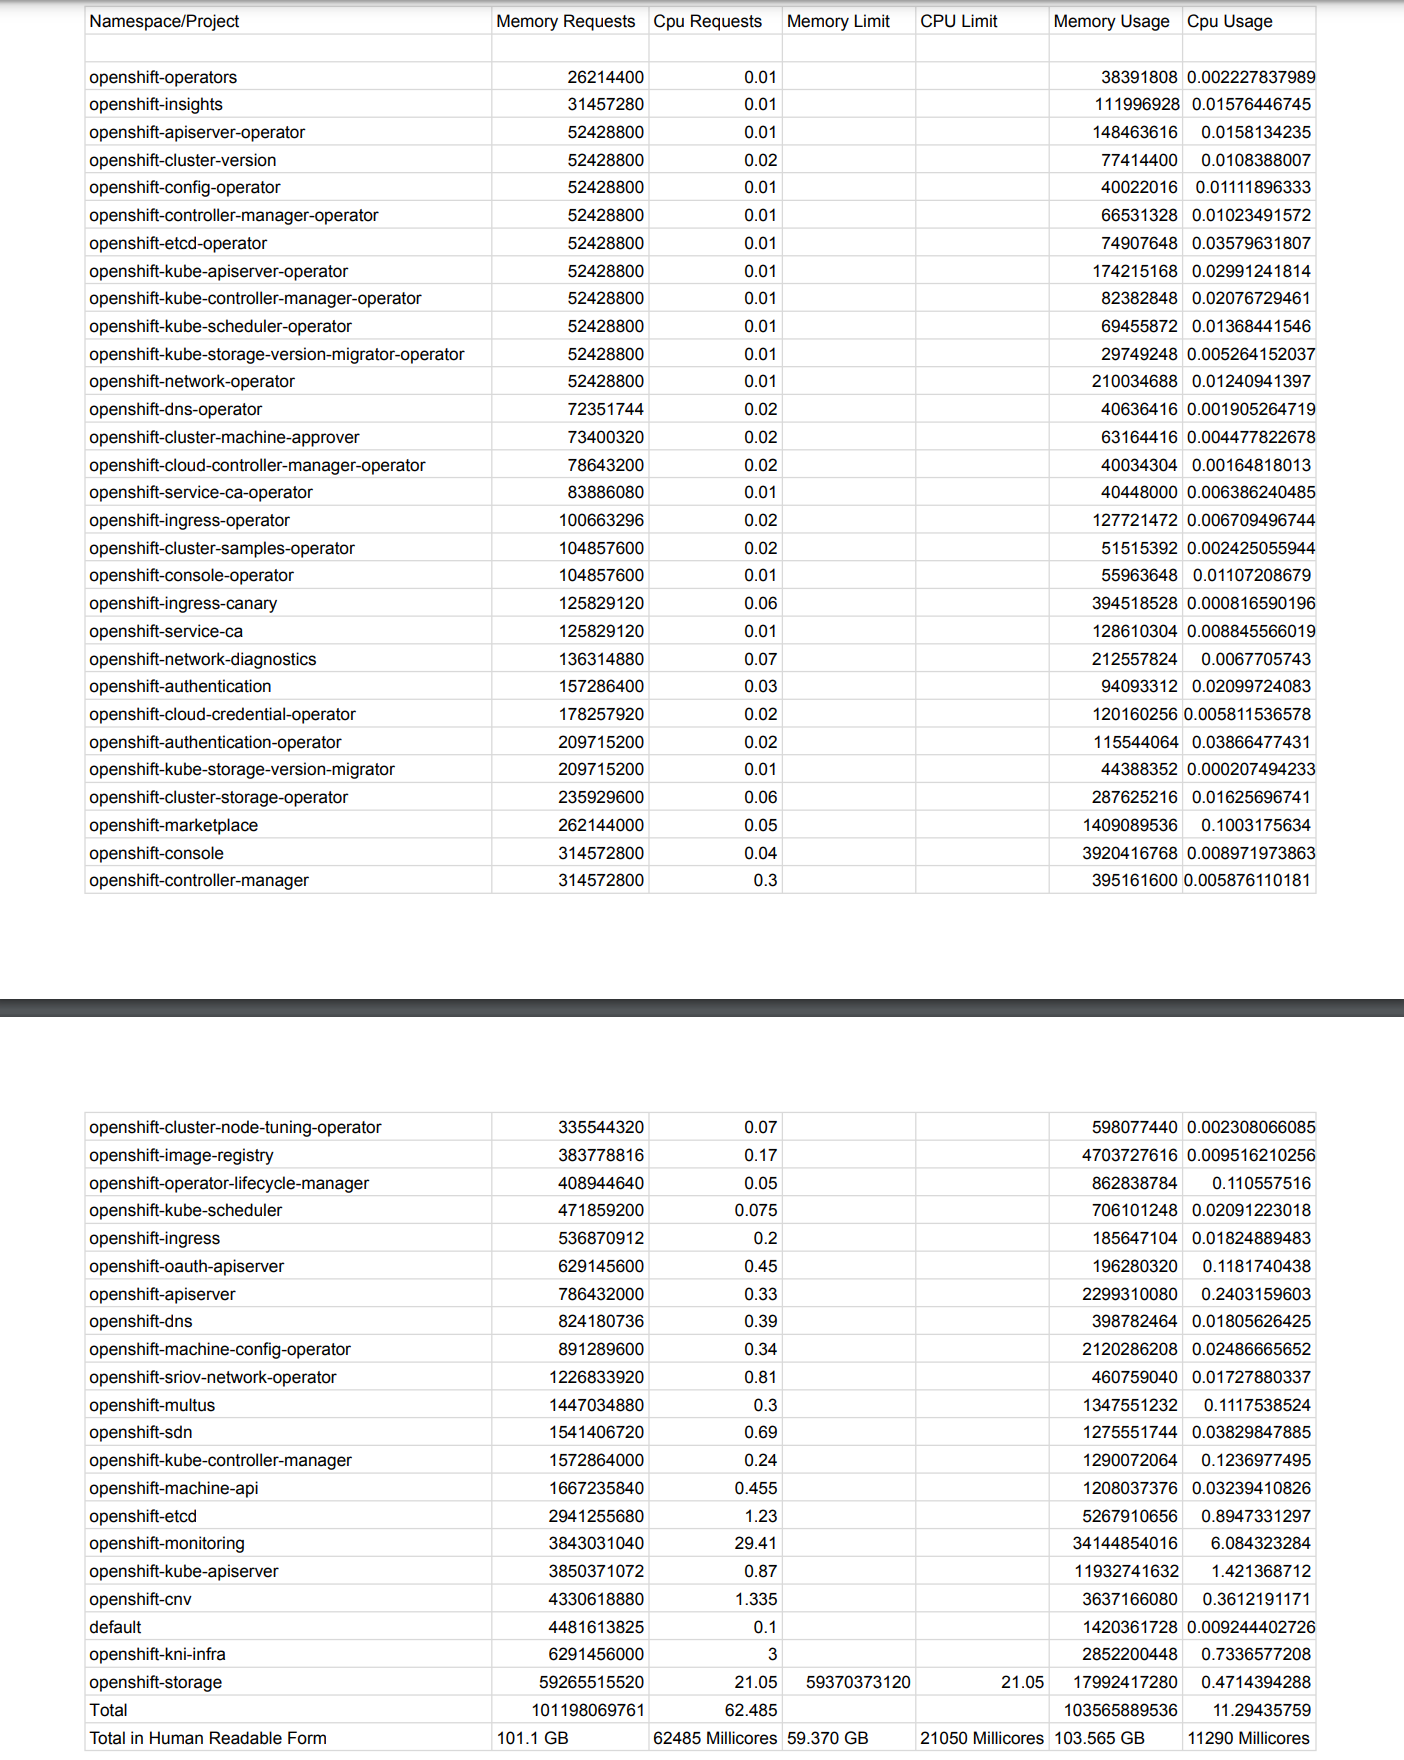
Since the Prometheus query presented the output into a table-like format, I could copy/paste this information into a text file.
Assuming this was run before any workloads were added to the system, I could simply take all of the output and massage it to a presentable format such as what is shown below.
Note: this output is from another cluster but this gives a general idea. The conversation below is based on this other cluster and not the same cluster I ran the previous commands on. Sorry if this causes any confusion.
For this output, all masters/workers were schedule-able so this made things easier. I can simply subtract the total numbers (listed in the spreadsheet) from the total processing power of all nodes in the cluster.
Let's assume that we have 6 master/worker servers each with 128GB of RAM and 32 thread (32000 millicores) each.
Total memory available for this configuration: 768 GB of RAM
Total Threads: 192000 millicores
There are no limits set on a majority of the Openshift namespaces/projects. I have a feeling this is by design (but I could be wrong) because we don't want any of these workloads to fail for any reason. Given that this is the case, we may want to go based on current utilization and add subtract limits that are set (to make available resources lower). ODF is the only limit that is set at 21050 millicores and 59.370 GB of memory. This number will be added.
Based on current utilization, our custom apps/workloads can consume up to the following:
Memory: 768 GB - 103.565 GB - 59.370 (limit) = ~605 GB available
CPU: 192000 (millicores) - 11290 (millicores) - 21050 millicores (limit) = ~160000 millicores available
I'd still recommend keeping resource utilization less than 50% but this is based on user preference. If the user wants to deploy less servers and keep utilization high (lower cost) or deploy more servers with lower utilization (more stable), that is their choice so it is not one size fits all for determining the correct threshold.
Hopefully, you enjoyed this article and found it informative. Much more to come