OpenShift Virtualization: Testing the Accuracy of the Metrics
In this article, I want to dive deeper into metrics and how they are displayed in the GUI.
Let's first create a virtual machine if you don't have one yet.
Virtual Machines
In the Openshift web console, under the Virtualization --> Virtual Machine views you will see any VMs that are currently running.
If you do not have a VM currently running in your environment, you can instantiate one by going through these steps.
- Go to Virtualization --> Virtual Machines
- Click "Create Virtual Machine"

Choose "From Template"
Pick the "Fedora" image
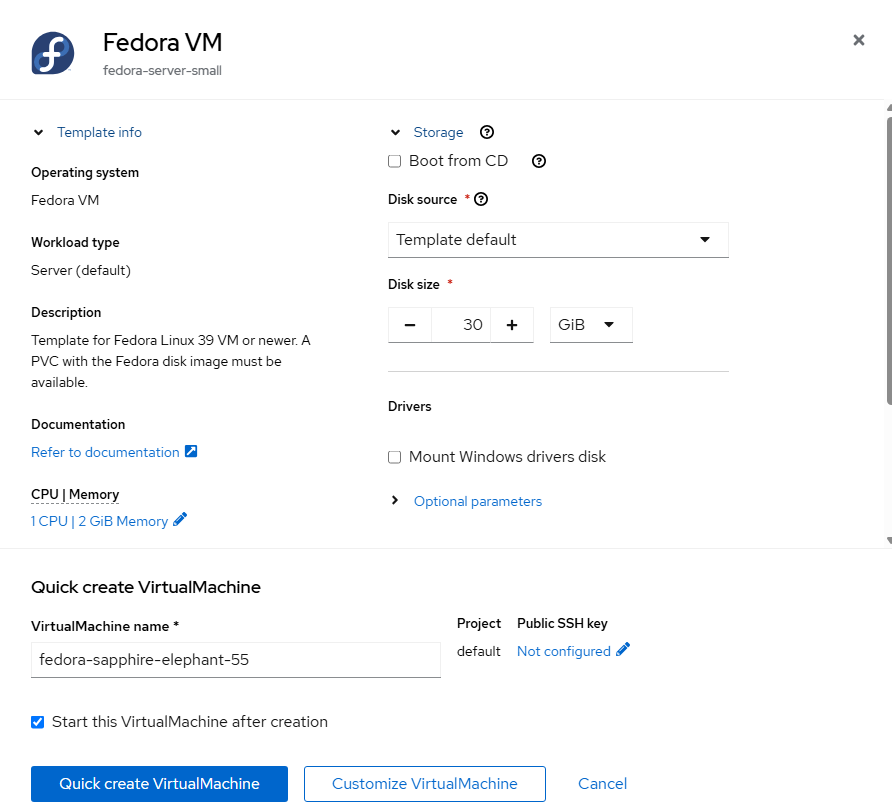
- On the resulting screen, choose the defaults which will be 1VCPU and 2GB of memory and click "Quick create VirtualMachine".
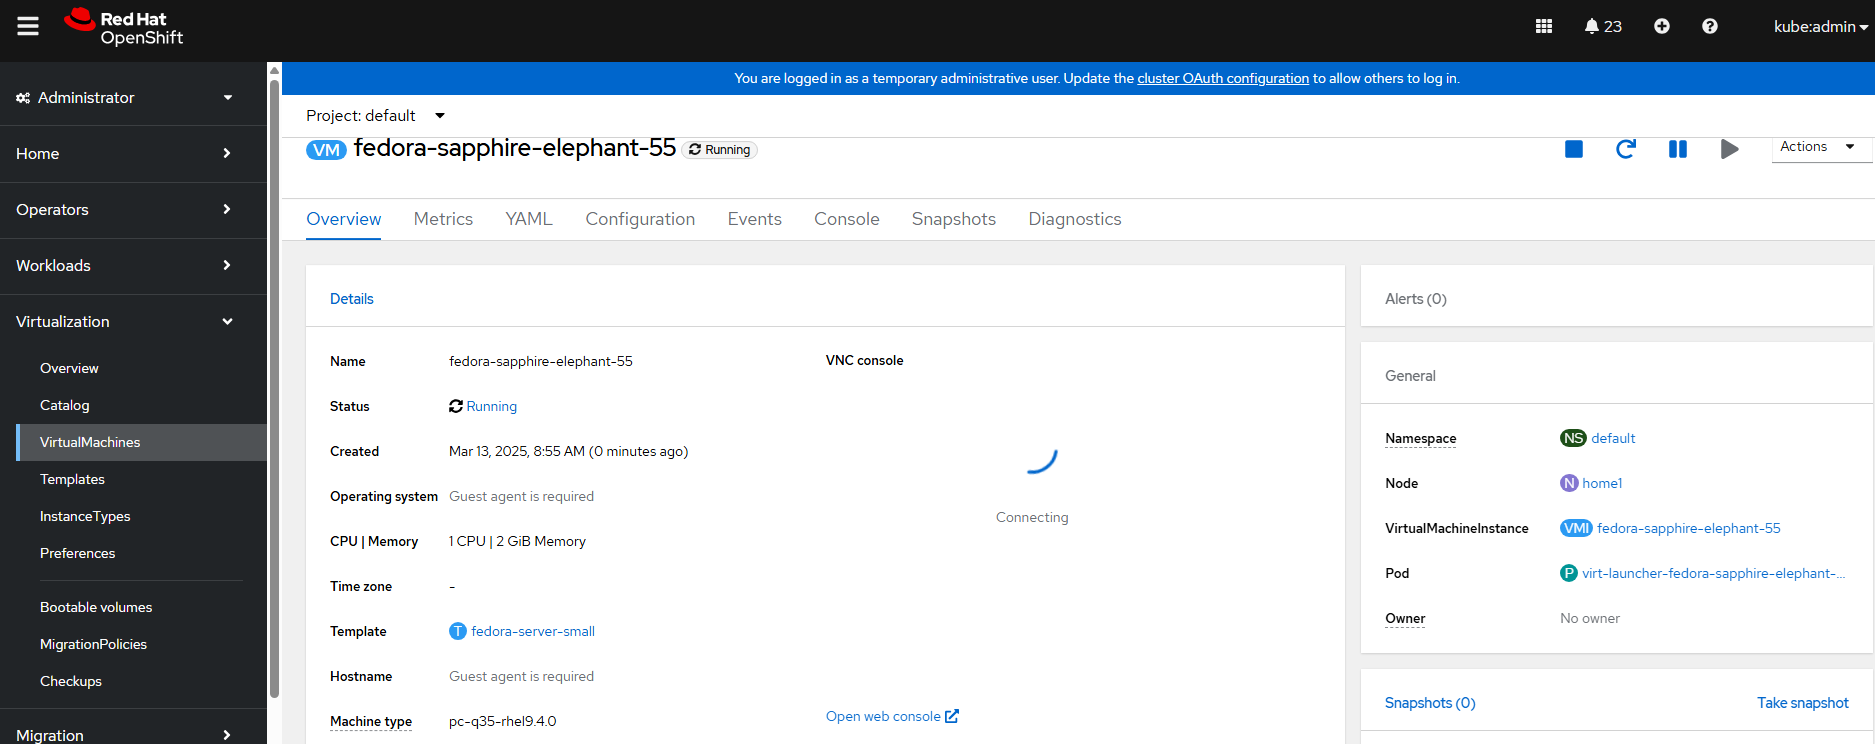
- In a short time the VM will go to a "Running" state.
- We will now login to start a memory test.
Click on the "Console" tab
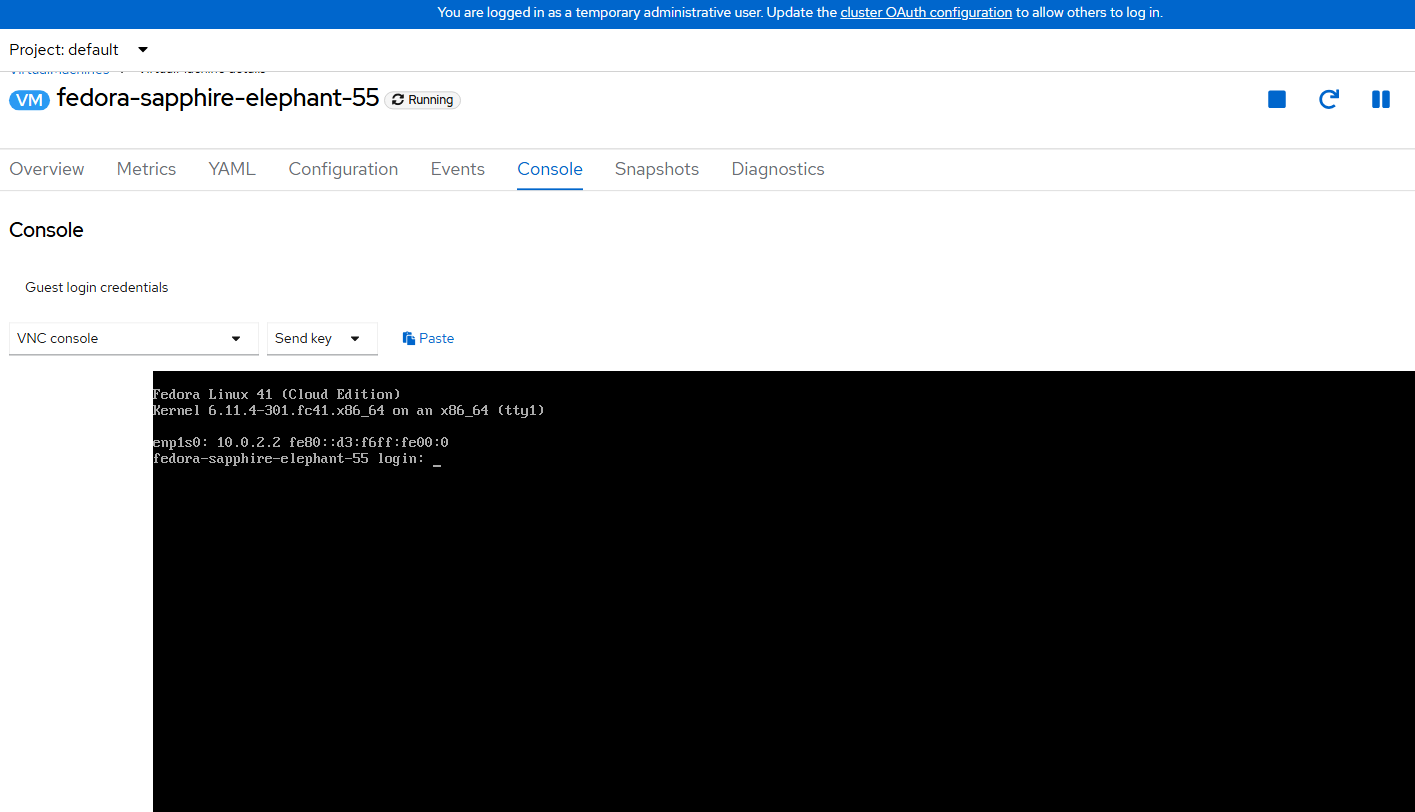
Click on "Guest login credentials". This will display the username and password for the VM (done via cloud-init).

- If you click the two sheets of paper to the right of the password, this will put the password in your clipboard
Type the username (fedora) and hit the paste button at the password prompt.
Viewing the Metrics
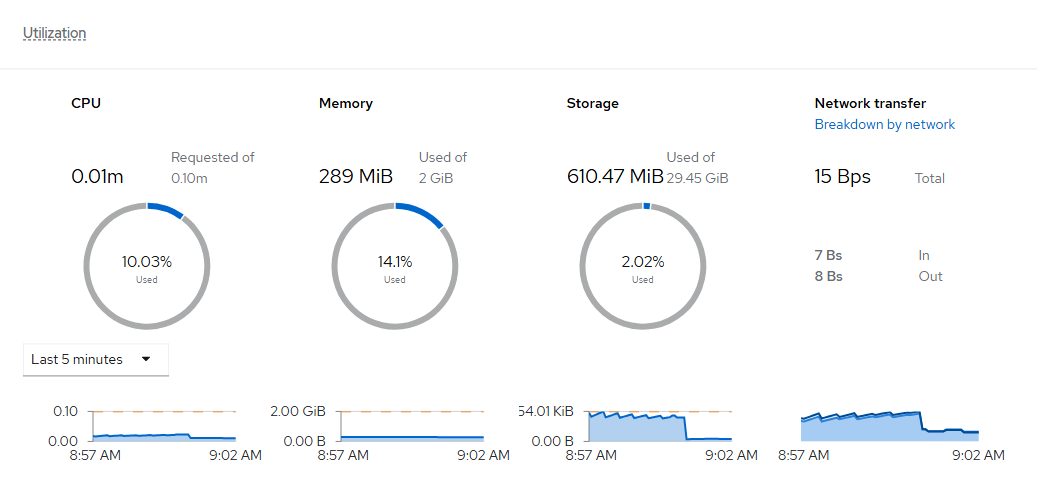
Within a few minutes, there will be some metrics that show for this VM. To view the current utilization (cpu/memory), go to Virtualization --> Virtual Machines and click on the virtual machine that was just created.
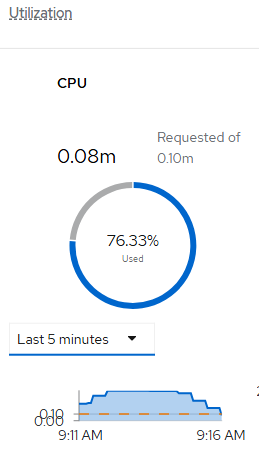
In the middle of this screen will be a Utilization tile. Take note of the current utilization. We will do some tests to verify the accuracy.
Installation of Test Utilities
In the Fedora VM that was created before, let's install some utilities that will stress test this system to verify the accuracy of these metrics.
- Install the "stress" utility.
sudo dnf install stress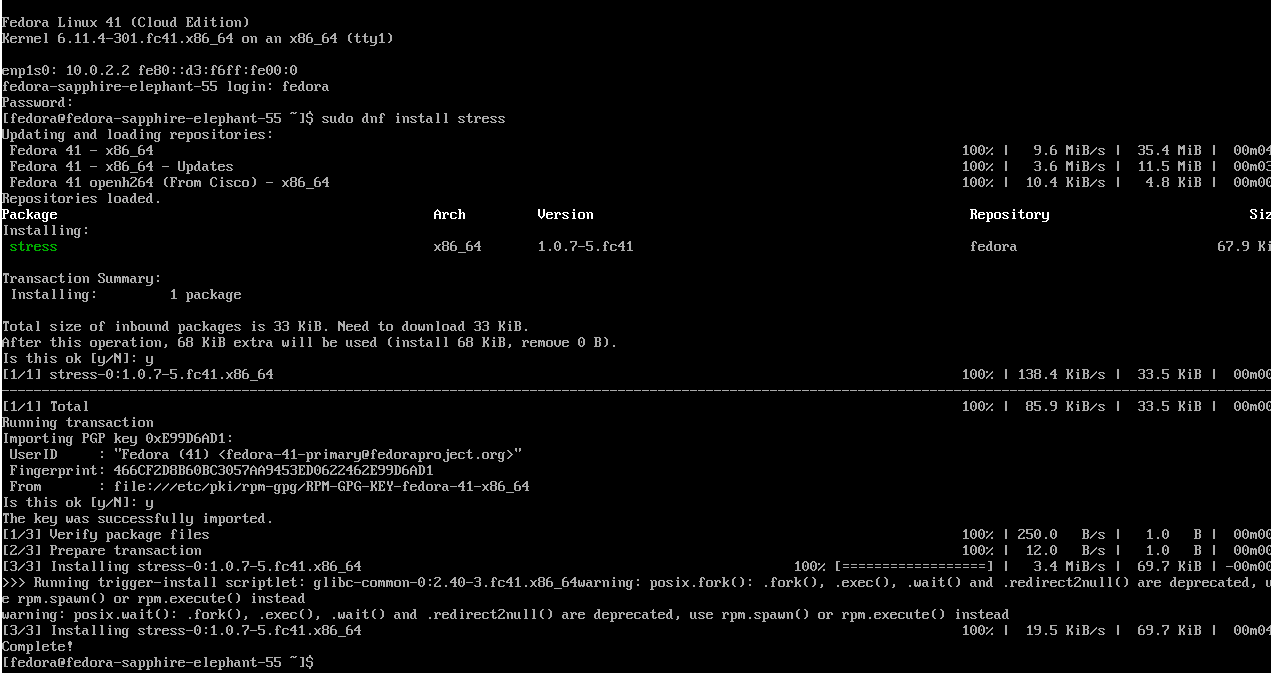
CPU Test
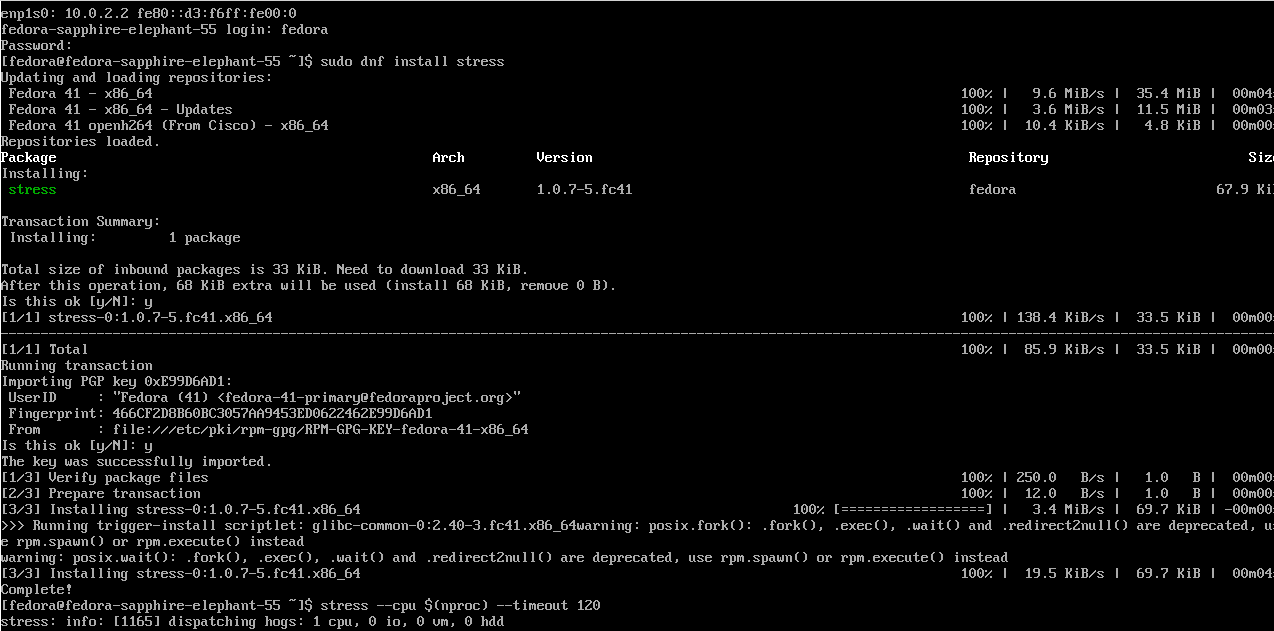
For the CPU test, run the following command:
stress --cpu $(nproc) --timeout 120This will run the maximum CPUs (1 in our case) for 2 minutes which is enough to show in the metrics graphs.
Go back to the utilization view under Virtualization --> Virtual Machines and click on the VM name you created. Click on the CPU graph.
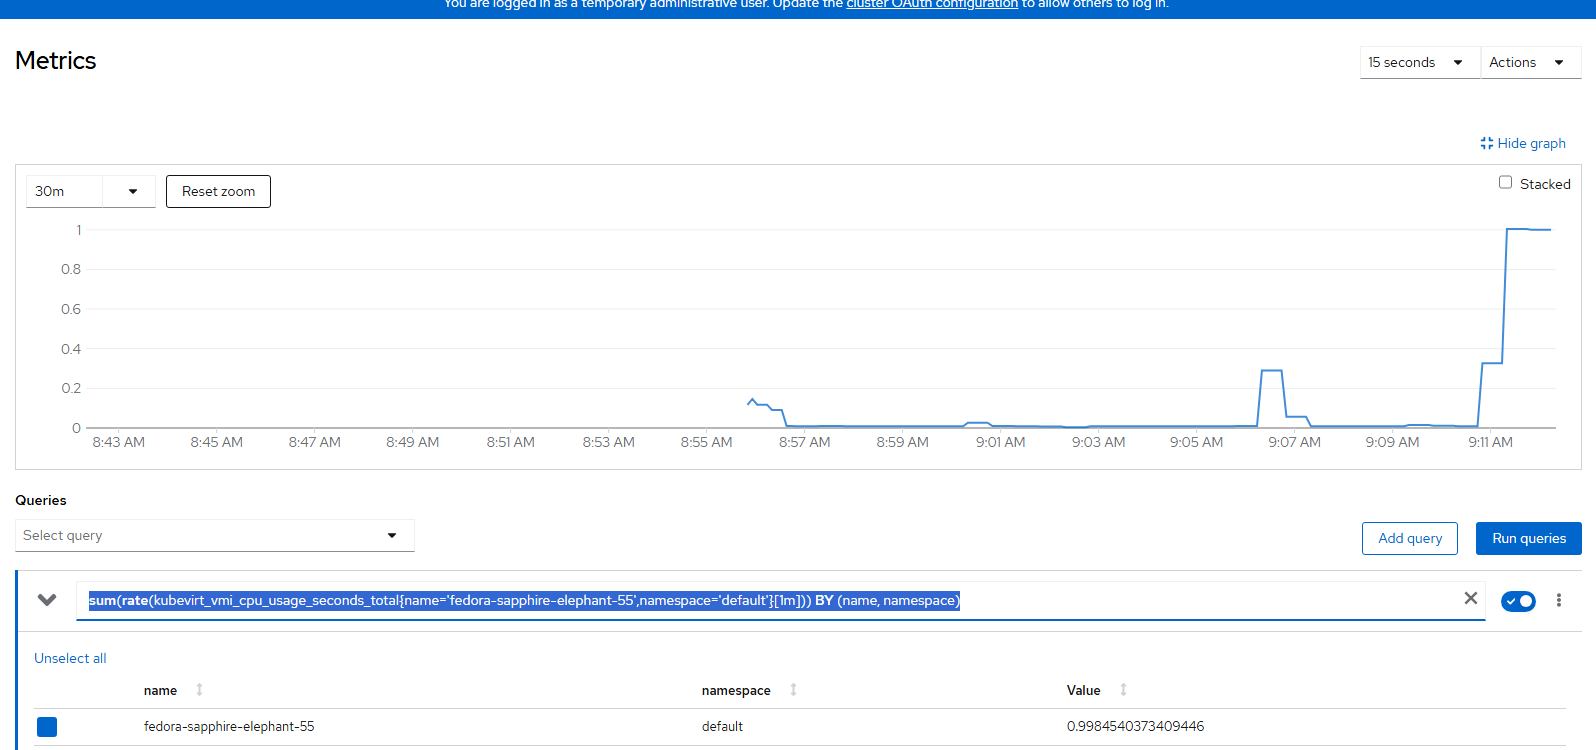
The lowest time range you will see by default is the last 5 minutes. Since it averages out over this period, the query would need to be changed from 5 minutes (5m) to 1 minute (1m) as shown below. Click "Run Query" after making this change.

This will now show that CPU was at 1 core utilization.
Memory Test
- Go back to the VM console and type the following command:
stress --vm 1 --vm-bytes 1G --timeout 120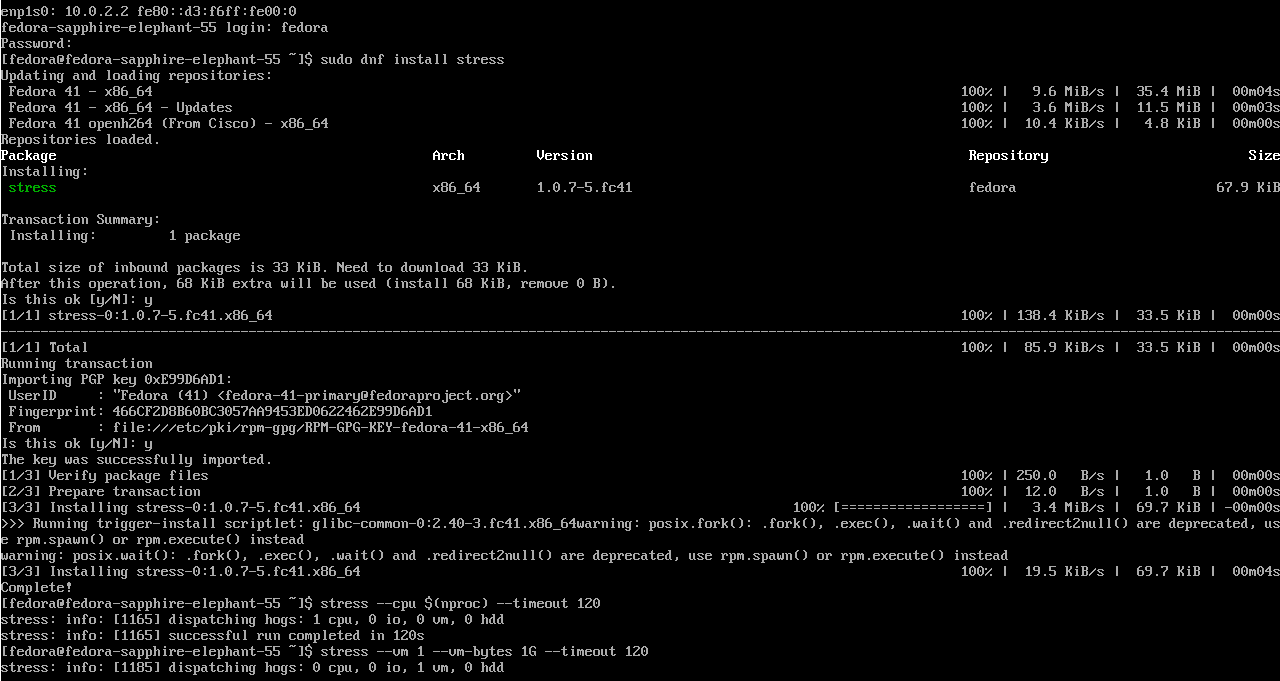
- Go to the memory graph
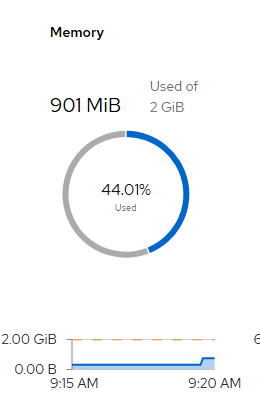
- Change the query time to one minute instead of 5 and click "Run Query".


You will see the graph spike to around 1GB of memory usage for a few minutes.
Storage
Run a df command on the VM console to see current usage for /dev/vda4
df -h
In my environment, there is 677MB currently used on this partition.
Let's create a large file (approximately 5GB) in size for this test.
- Run the following command:
dd if=/dev/random of=/home/fedora/testfile bs=500M count=2- Now check the usage again

It is using 1.8 approximately now.
- Let's go back to the GUI to verify
Under the VM overview page, you will see these metrics are updated

Networking
To see networking utilization for a particular VM, go to Virtualization --> Virtual Machines and click on the one you created earlier.
On the utilization tile will be see something like this:
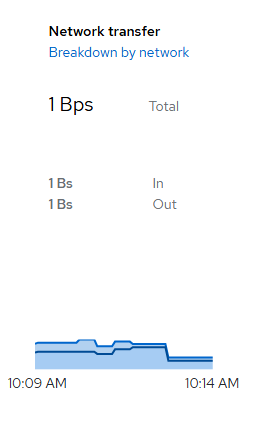
Right now, this VM only has the default/pod networking. Click on the "Breakdown by network" link.
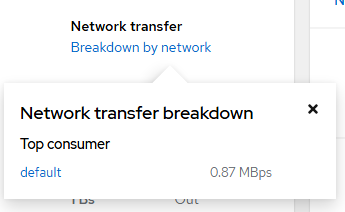
The information captured here is in Megabytes per second. There are 8 bits in a byte so there is roughly 100 kilobits per second throughput (basically nothing going on). Let's change this
On the VM, I will install the speedtest utility.
- Use dnf to install speedtest
sudo dnf install speedtestThere are about 228 packages to download for this. Doing this by itself will show some network transfer.
Let's also install speedtest-cli
sudo dnf install speedtest-cliThis takes about a minute to run on my system so it's a good test by itself.
- Let's see what this looks like in the GUI
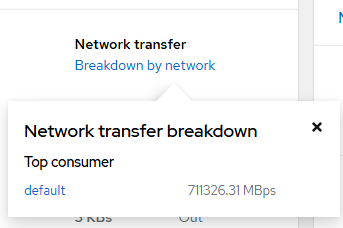
This shows roughly 88 Megabits per second.
- Let's actually run a speedtest now.
I will run this 5 times to generate about a minute of throughput
for i in `seq 1 5`; do speedtest-cli; done;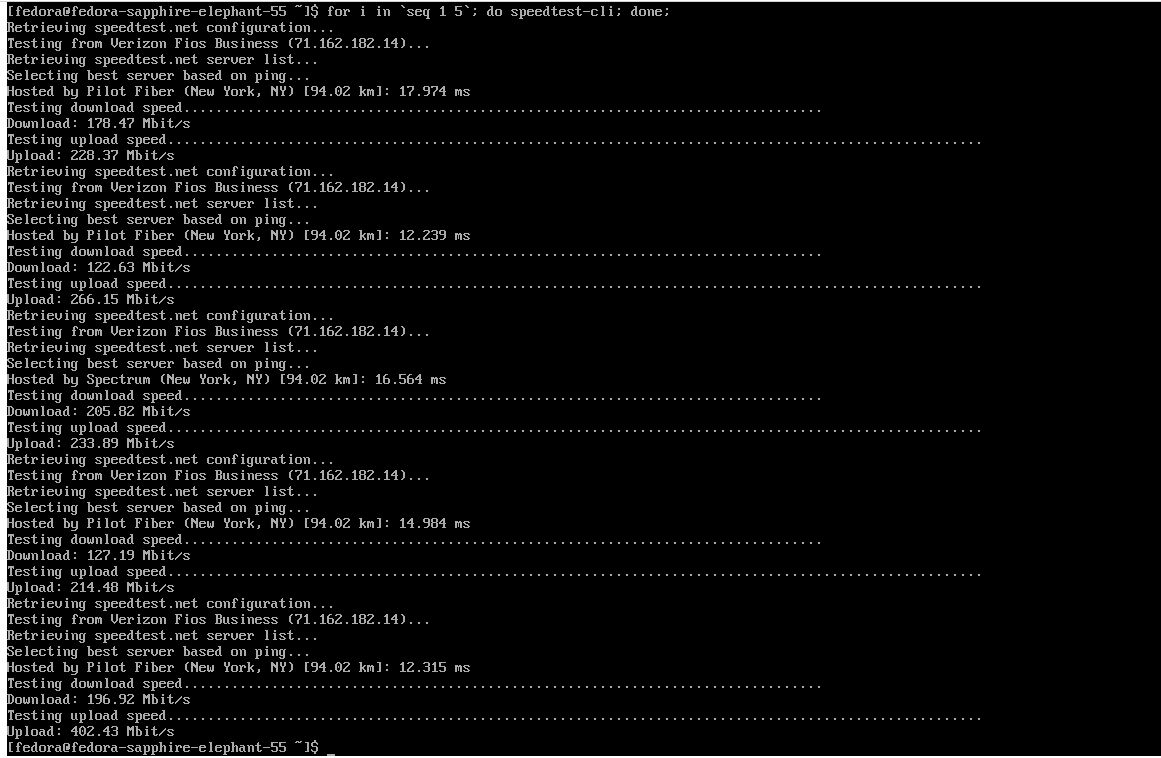
- Now go back to networking dashboard

I hope you enjoyed this article. More to come real soon.
