OpenShift Virtualization: Observability and Metering (Part 1)
In this first post, I will first provide an overview of the default information that is shown in the OpenShift web console at the cluster level. This relates mostly to cluster health and the standard Kubernetes constructs that run in OpenShift out of the box with some openshift-virtualization aspects thrown in.
For the second part, some of the observability components will be installed and demonstrated. The observability components that will be shown in the article include:
Cluster Observability Operator
Logging
Monitoring
OpenTelemetry/Metering
After developing a working knowledge of these topics, I will dive into how all of this relates to an OpenShift provider that is using OpenShift mostly for hosting virtual machines (VMs) in part 3. For this demonstration, let's assume that we are a network provider and will be providing virtual machines to customers based on OpenShift Virtualization.
At the provider level, we will need to know how to use some of this information (specifically the metering) to be able to bill clients appropriately. Some custom Grafana dashboards and mention of the OpenShift Cost Metrics operator will help with some of this.
Lastly, we would also need to have accurate reporting and be efficient at troubleshooting issues that arise in this type of environment.
Default Views
When going to the Openshift web console, there are some views that are available by default. They will be covered briefly here.
Immediately after logging into the console, you will be taken to the Home --> Overview section. There are a few tiles shown in this dashboard that are important.
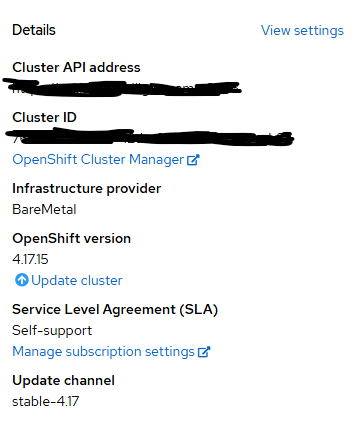
Details:
This section is typically upper left corner tile and will show some very general information:
Status:
In the middle top tile, there is color-coded status information with the ability to view alerts that are firing directly from this screen. Some of the more recent alerts are shown in the bottom part of this tile as well.
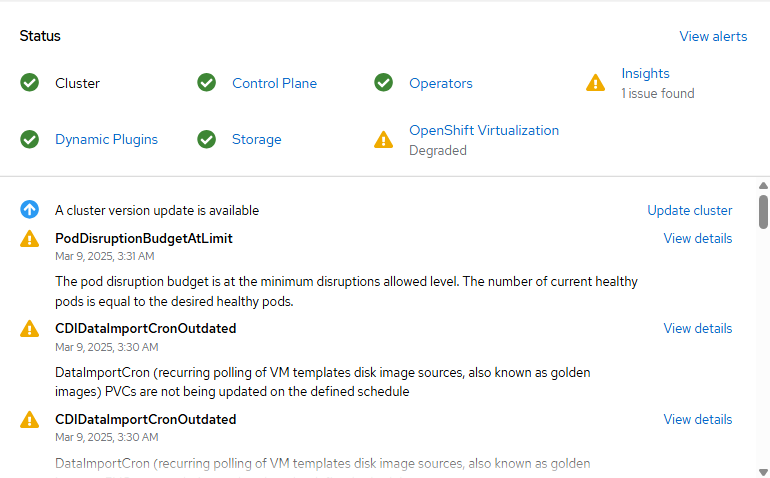
You can get more details on the following if you'd like by clicking on the blue hyperlinks such as Control Plane, Openshift Virtualization, etc.
Here is an example showing a more detailed view of the Openshift Virtualization status link.
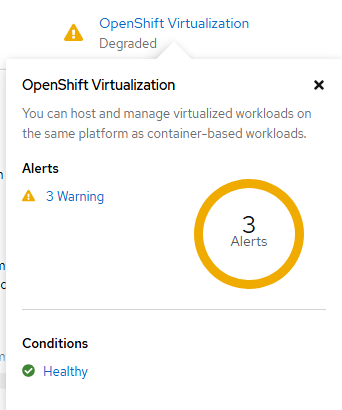
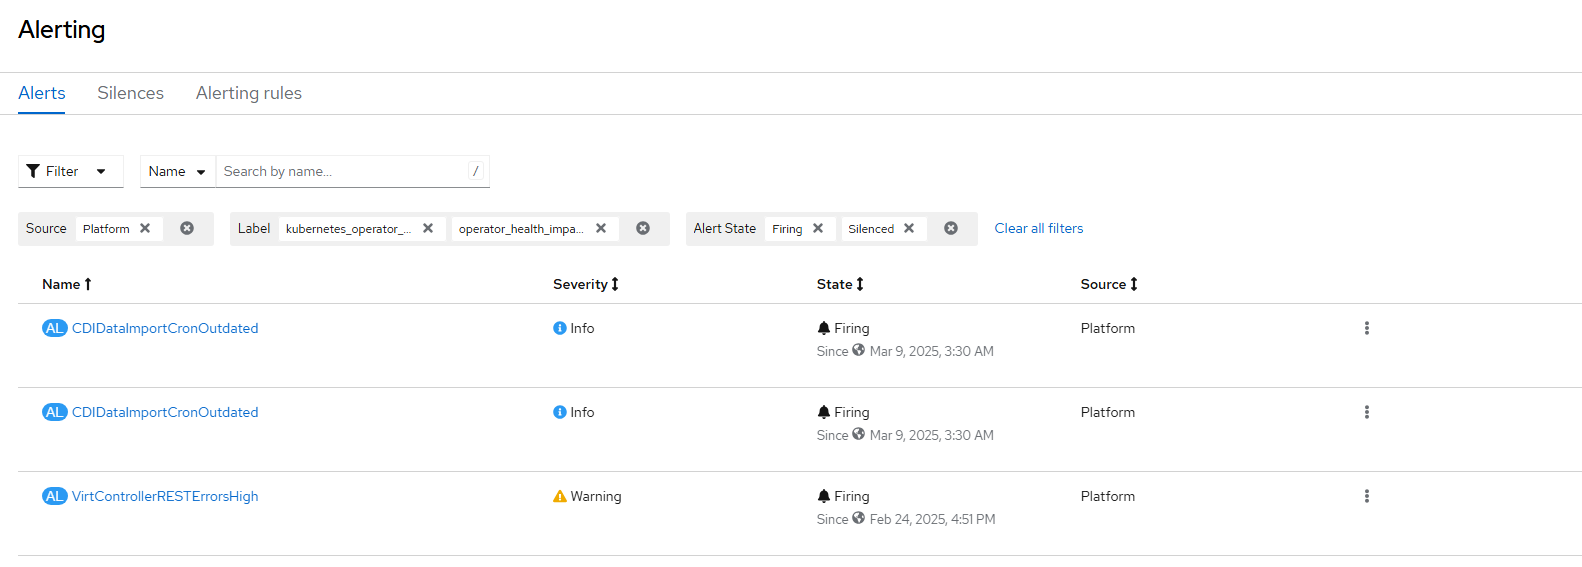
As you can see, there are a few alerts firing off in my environment. To see more details, clicking on the "3 Warning" link bring up a filtered alert view which filters by Kubevirt/Openshift Virtualization messages that are either in firing or silenced state.
Activity:
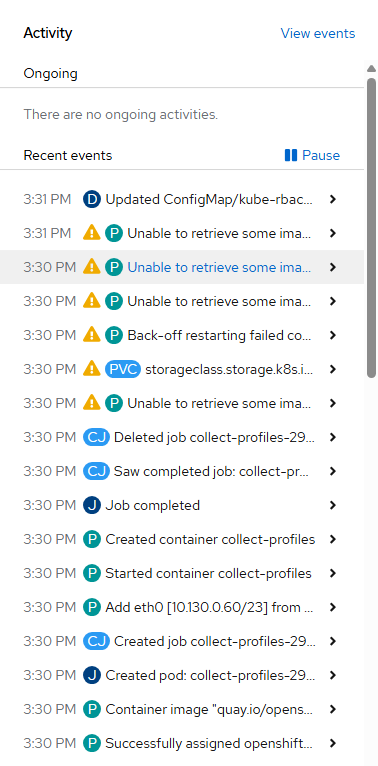
In the right middle of the screen will be an Activity view. This shows current Events in OpenShift environment. Clicking on view events from this tile will take you to the Home --> Events menu.
Cluster Inventory:
In the bottom left tile, the main object types such as nodes, pods, storage objects, and virtual machines. If there are any pending objects of the associated type, a circle will show up next to the name as shown below. Of there is an object in a failed condition, it shows up with an exclamation point and the number of associated objects of that type in error state.
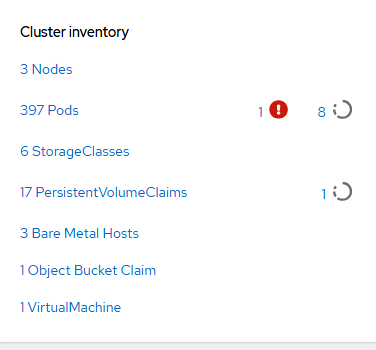
Clicking on any of these icons will drill-down to more detailed information about that status. In this example, clicking on the 1 in exclamation point tells me about a Nvidia driver pod that is failing in my environment.

Cluster Utilization:
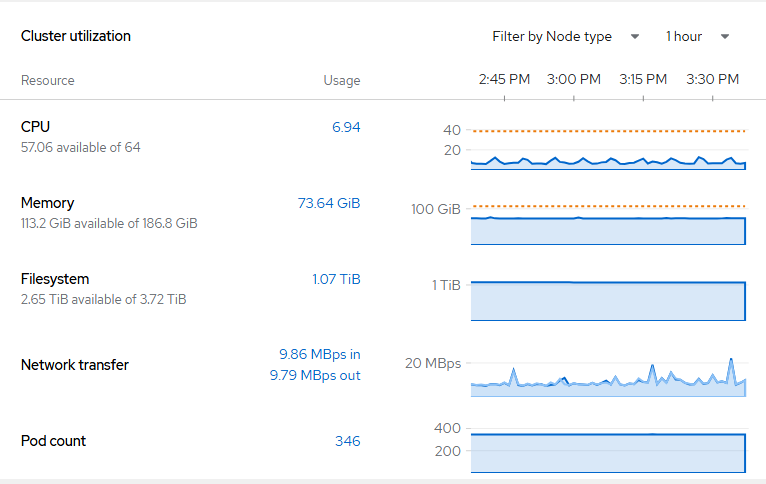
In the bottom middle tile is metrics information (mostly counts) showing current utilization of compute resources in the OpenShift cluster. Clicking on the graphs or number will show you the exact query that is being run in Prometheus to get this information along with more information.
Observe Menu
By default on the Observe menu alerting, metrics, dashboards, and targets are shown. Let's dive into these a little more.
Alerting:
There are three tabs here called Alerts, Silences, and Alerting Rules
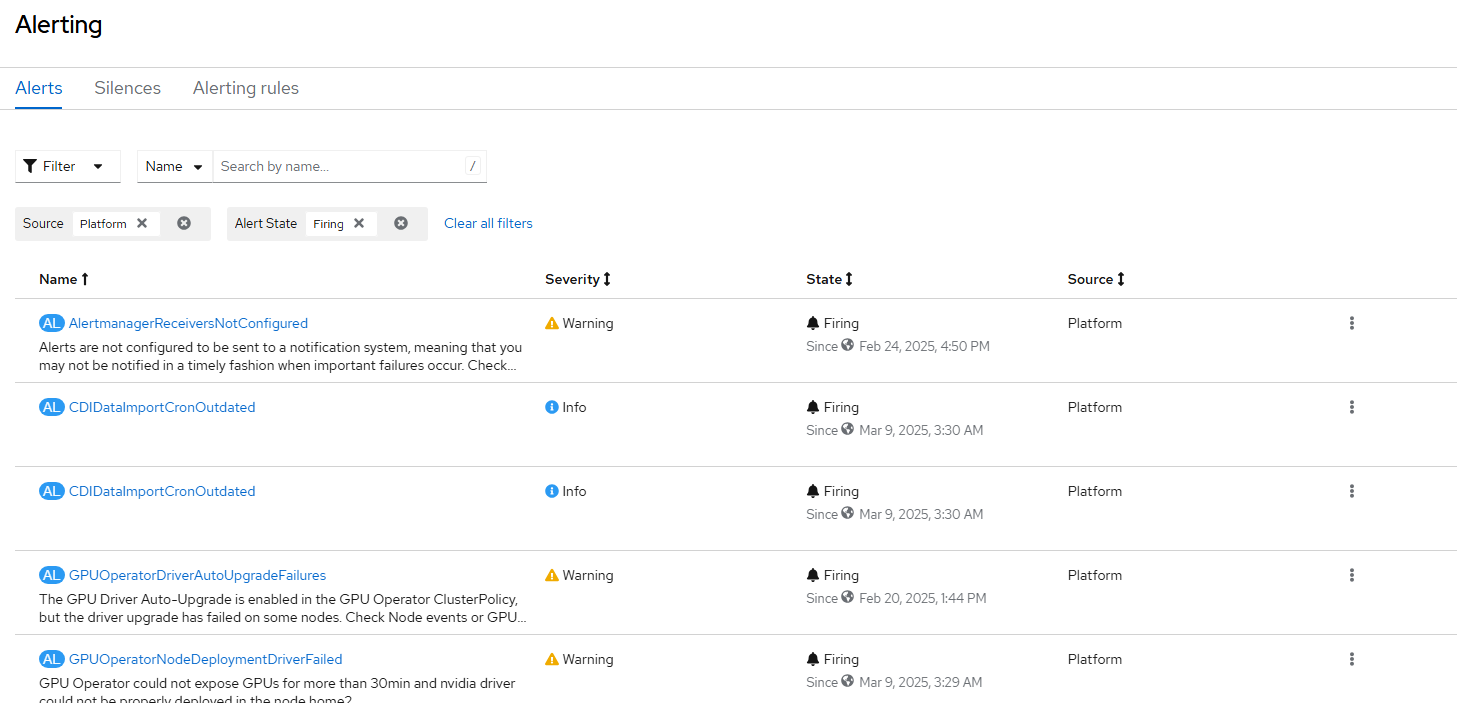
Alerts will show anything that is currently firing.
Here is a view of some of that information in my environment.
Silences:
This shows alert messages that I want to ignore for now.

Alerting Rules:
Alerting rules is all of the alerts that are configured in OpenShift.
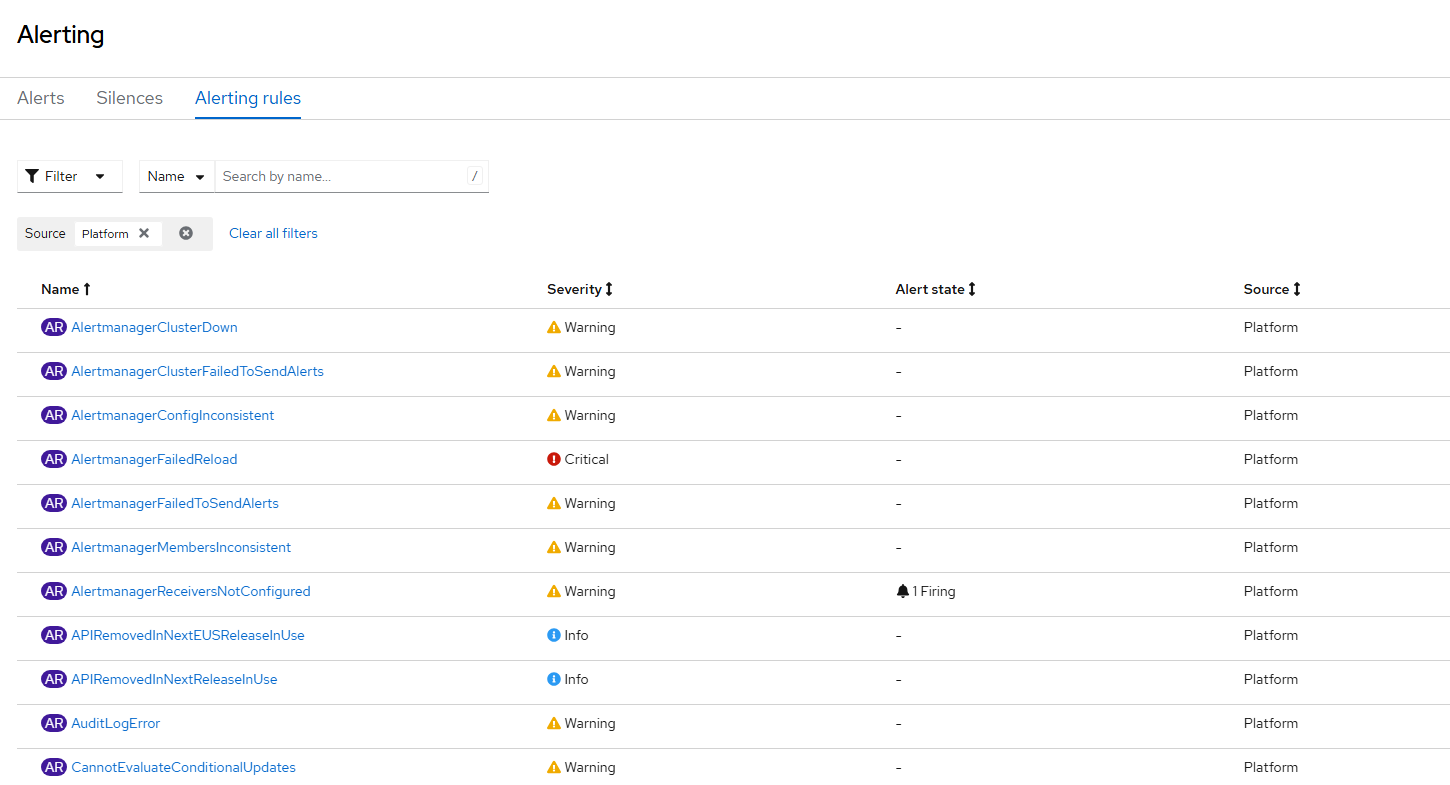
Here is a list of alerting rules that come pre-install with OpenShift Virtualization. To find these on your own:
Filter:
Source: Platform
Label: kubernetes_operator_part_of=kubevirt

To get this same information on the command line, run the following command
oc get cm prometheus-k8s-rulefiles-0 -n openshift-monitoring -o yamlHere is a list from the GitHub repo of the alerts that are specific to openshift-virtualization operator.

Here is an associated file
Metrics:
This screen has some pre-populated queries that can be run and you can also run your own.
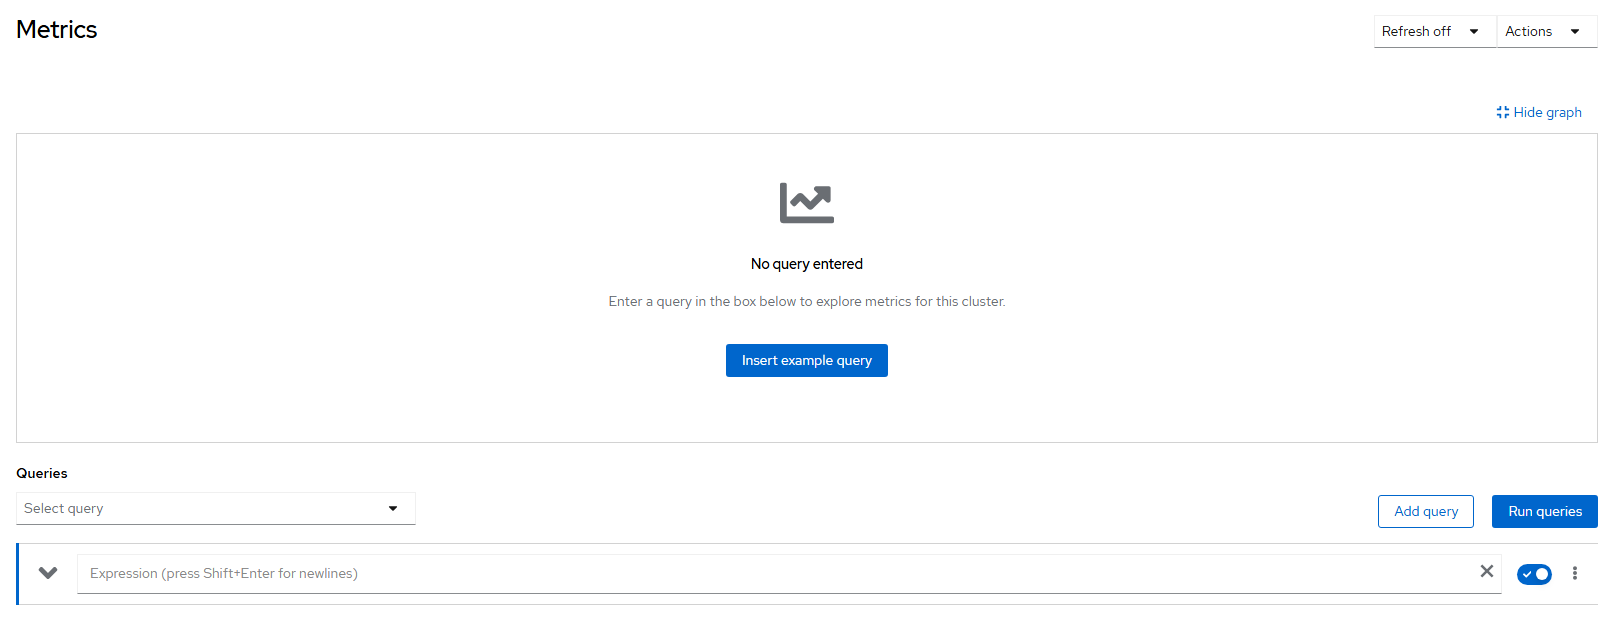
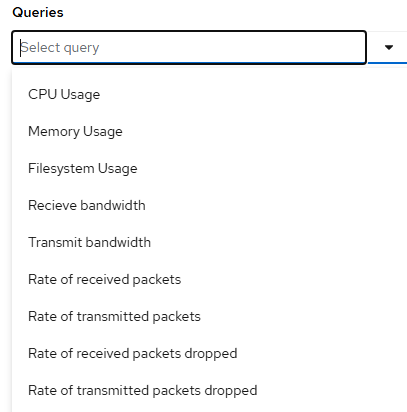
Pre-populated queries based on similar to the following:
When selecting any of these "CPU Usage" as an example, the following screen is displayed:
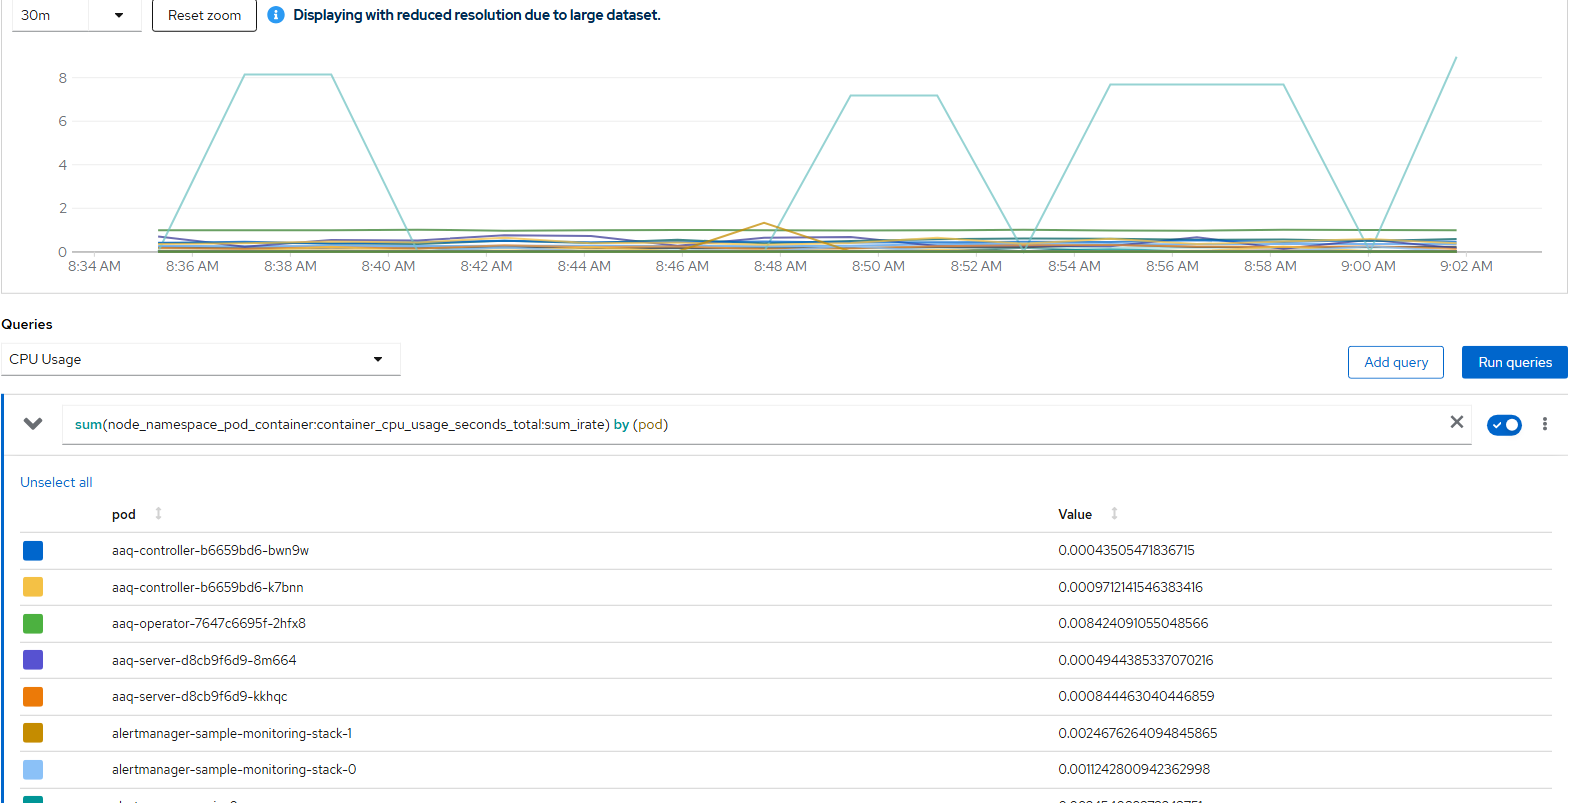
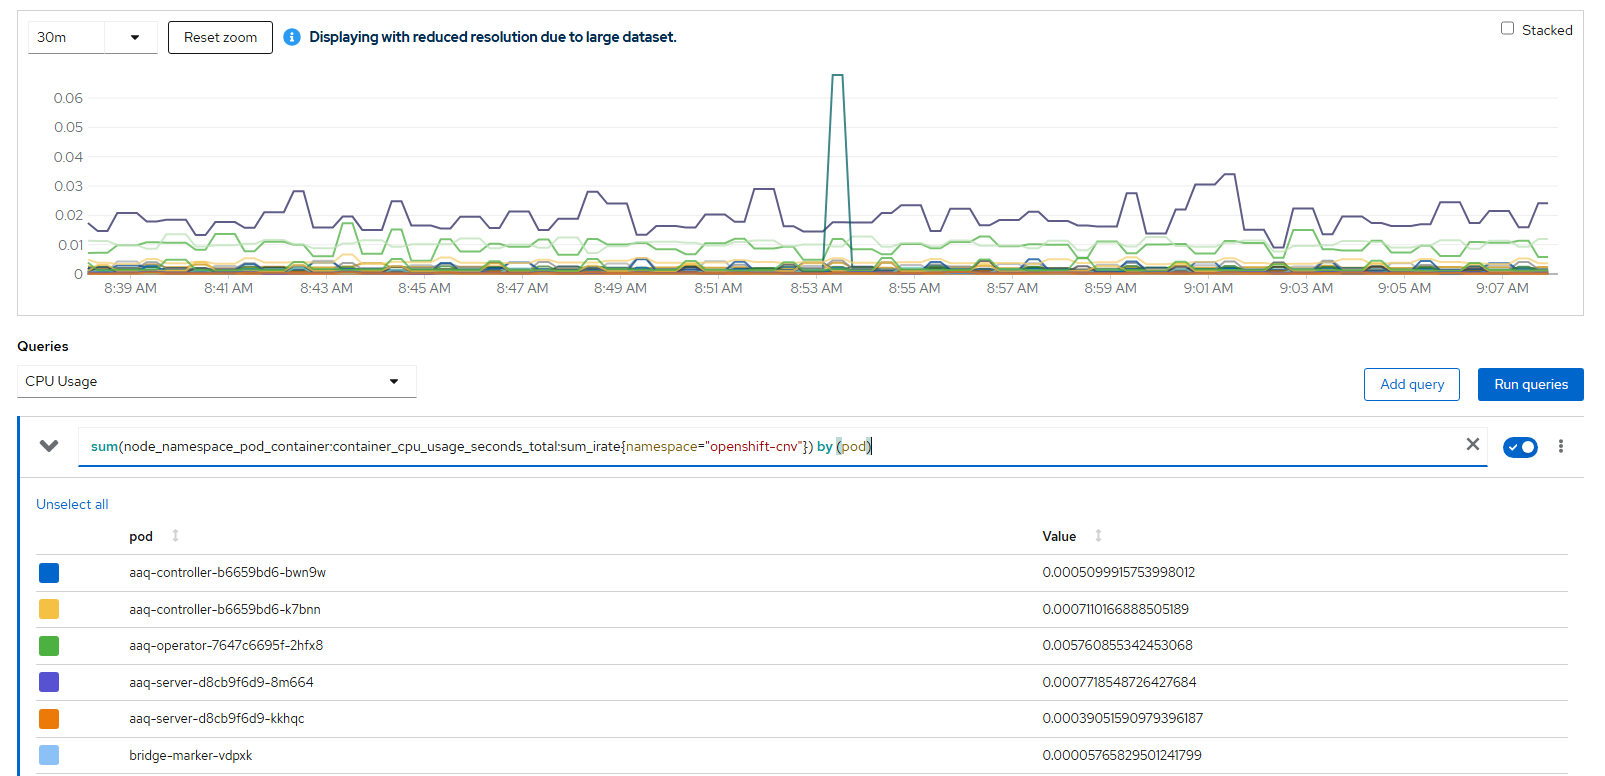
By default, this shows all pods in all namespaces. Let's modify this query a little bit.
sum(node_namespace_pod_container:container_cpu_usage_seconds_total:sum_irate{namespace="openshift-cnv"}) by (pod)Now you will only see Pods in the openshift-cnv namespace/project
Here is a list of some metrics that come out of the box based on Openshift virtualization
Dashboards:
Under the Dashboard menu are promql queries that have been grouped together based on common tasks such as monitoring etcd health, compute/node resources, networking, storage, virtualization, etc.
If I select the "KubeVirt/Infrastructure Resources/Top Consumers", this shows specific kubevirt-related metrics.
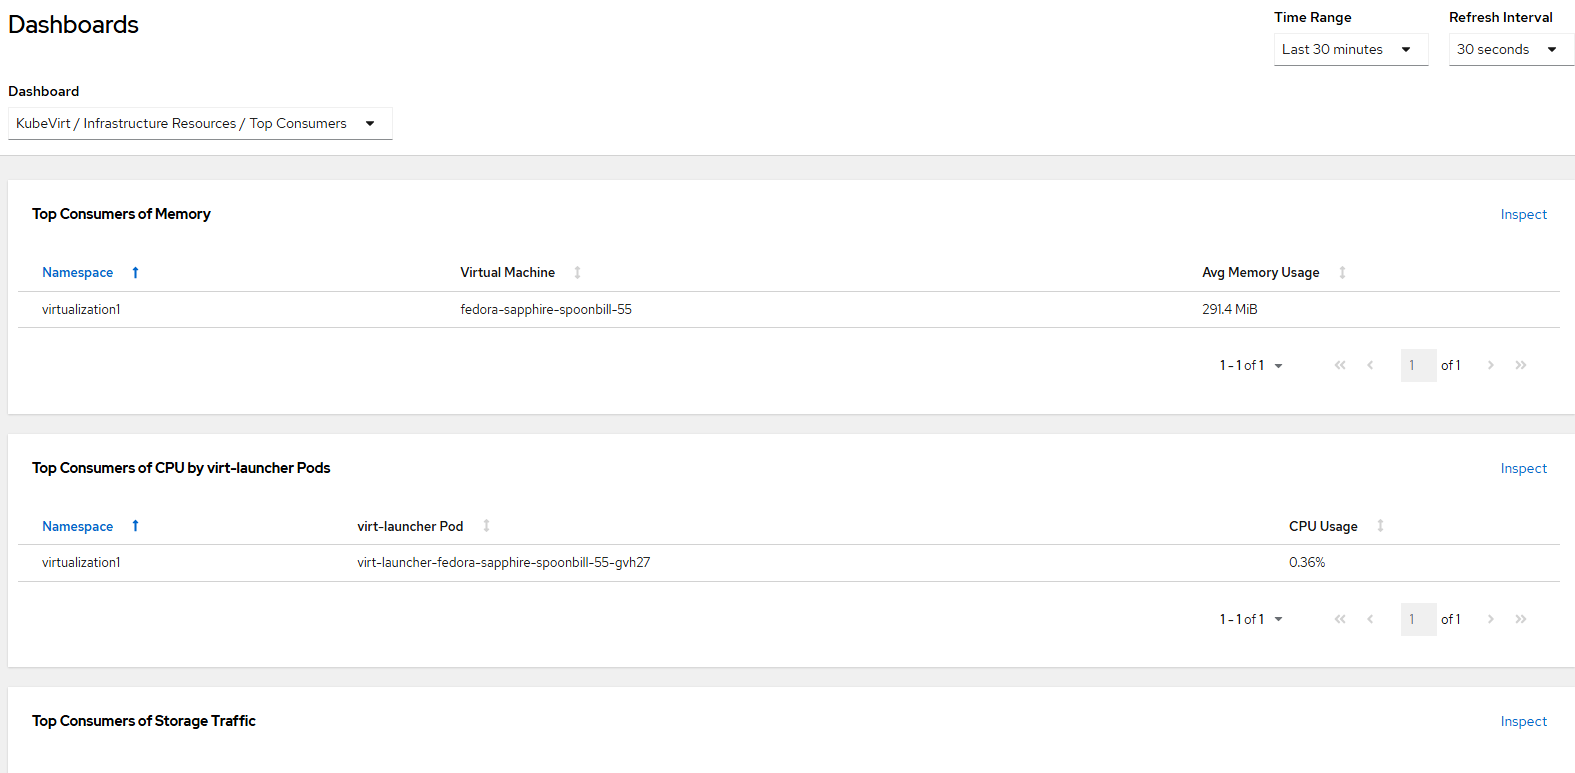
Clicking inspect, will take you to the promql query which shows the exact query that was run for each tile. For example, "Top Consumers of Memory" is the following promql query:
sort_desc(topk(5, sum (avg_over_time(kubevirt_vmi_memory_available_bytes[1800s]) - avg_over_time(kubevirt_vmi_memory_usable_bytes[1800s]))by(name, namespace)))>0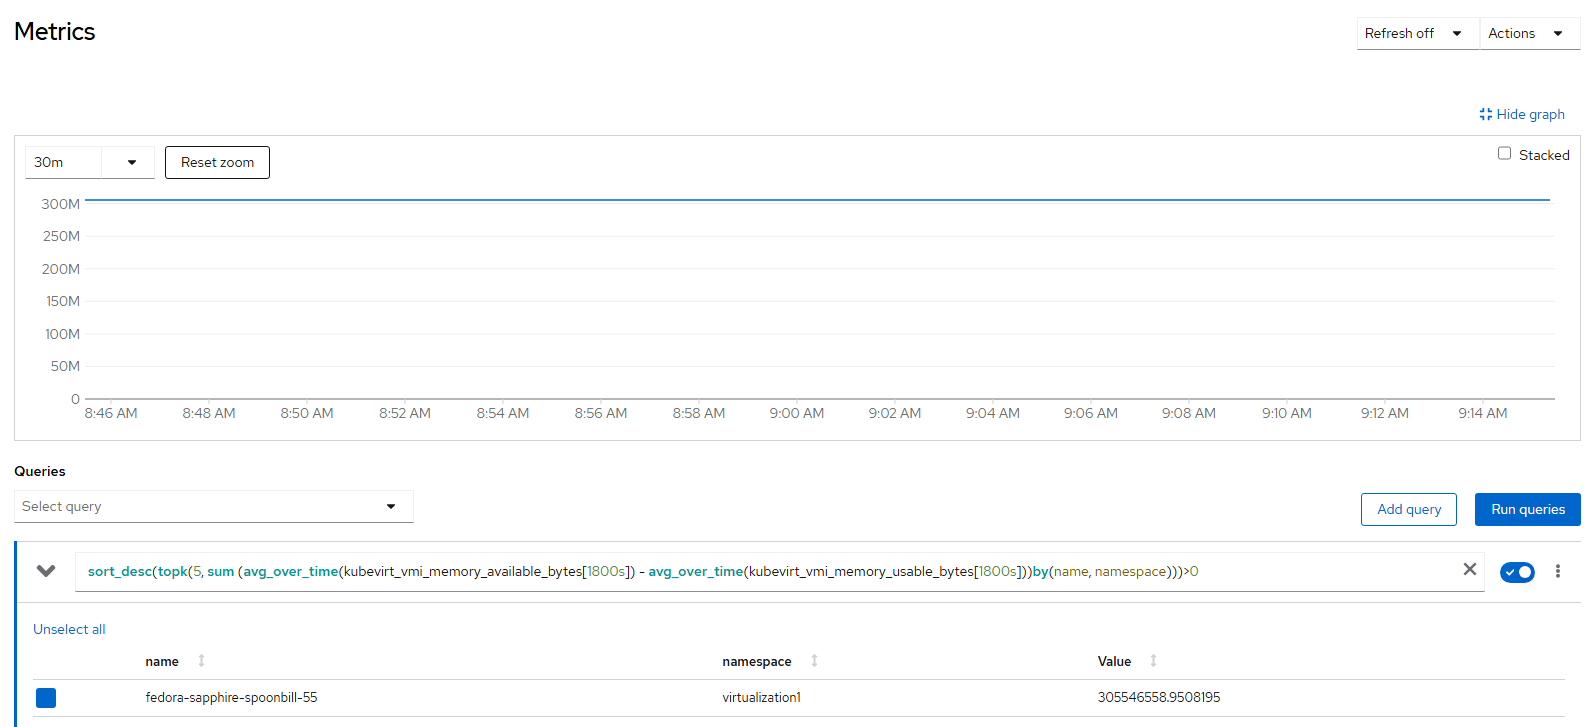
To see the list of dashboards that are configured by default, on the command-line run the following:
oc get cm -n openshift-config-managed|grep dashboard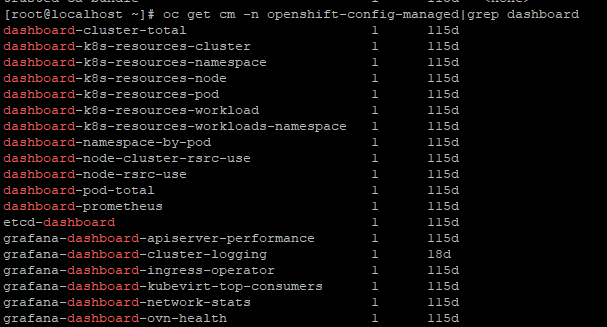
These are JSON files that you can create yourself based on Grafana. Customizing this will be covered later in relation to the Cluster Observability Operator.
Targets:
There are ServiceMonitor endpoints defined here that can be scraped to gather metrics data as well. I will do a deeper dive into this in another part of this series but for now, let's see what is here.

Let's look at one that is specific to Openshift-Virtualization. I will show this information on the command-line
oc get servicemonitors.monitoring.coreos.com -n openshift-cnv
To see the endpoints that are available that are ServiceMonitor instances in the openshift-cnv namespace/project, run the following:
oc get ep -n openshift-cnv|grep metrics
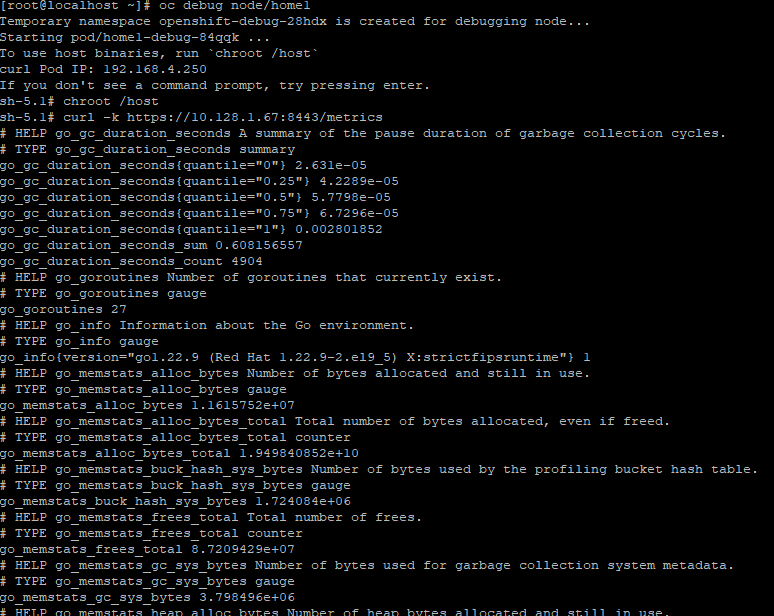
Let's scrape one of these endpoints to see what is there. The end points are pod IP addresses. They typically are scraped from other services from inside the cluster but can also be exposed externally as well through a load-balancer mechanism such as Metal-LB or a NodePort resource.
The most direct way to query this for now is to go on one of the nodes in the cluster
oc debug node/<nodename>
chroot /host
## One of the endpoint IPs listed above associated with kubevirt-prometheus-metrics
curl -k https://10.128.1.66:8443/metrics
You will see a bunch of counters that can be parsed by your own monitoring applications.
I know this was a lot but I will show you how to tie all of this together in the follow-on articles to come.
