Openshift Virtualization: Installing Grafana Operator and Custom Billing Metrics
In this blog, a customized billing dashboard will be created.
The main point of this article is to show you what is possible to do on your own if you choose using upstream/community Grafana operator. It also gives you an idea of the metrics that are available in relation to OCP Virtualization. All of this is useful if customers prefer not to send their data to console.redhat.com using Insights or if they are in a disconnected/air-gapped environment.
The Code
The code for the billing dashboard is here:

This code was developed by Balkrishna Pandey who is another member of our Tiger team. Check out his blog. He has some great articles about OpenShift, AI, and a lot of other stuff.

Installing the Grafana Operator
- On the command-line, create a project called "grafana".
oc new-project grafana
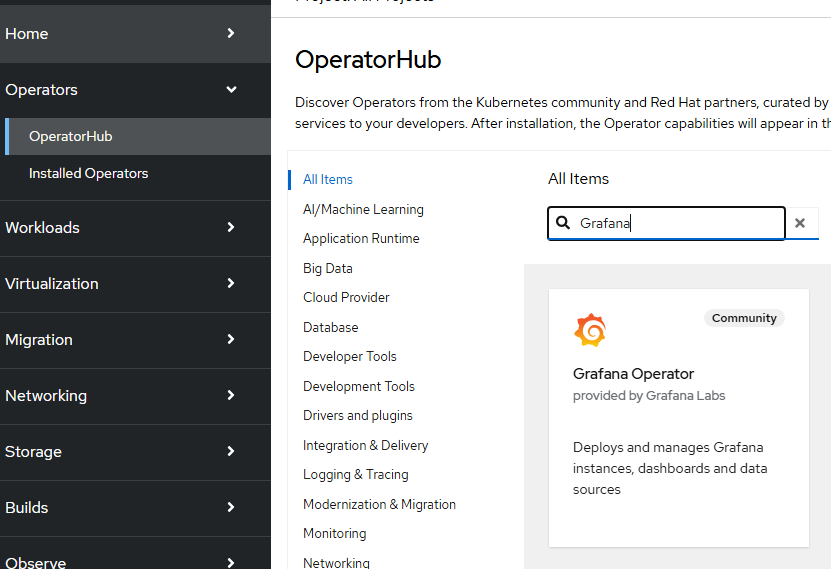
- On the Openshift web console, go to Operators --> OperatorHub and search for Grafana and click on this box.
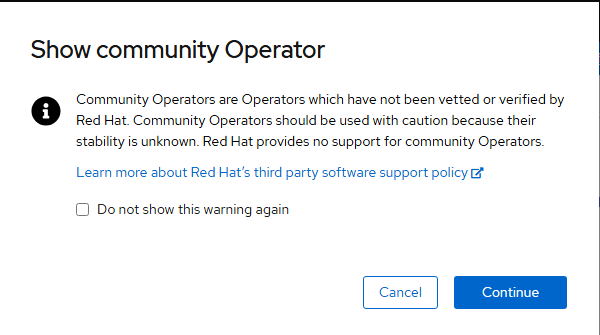
A warning message will appear as informational message indicating that this operator has not been vetted or tested by Red Hat. You can hit "Continue".
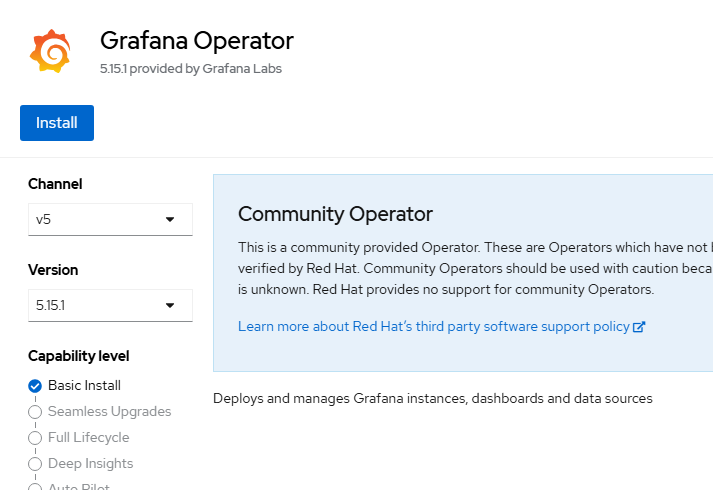
- Accept defaults and click "Install".
- Accept the defaults again and click "Install".
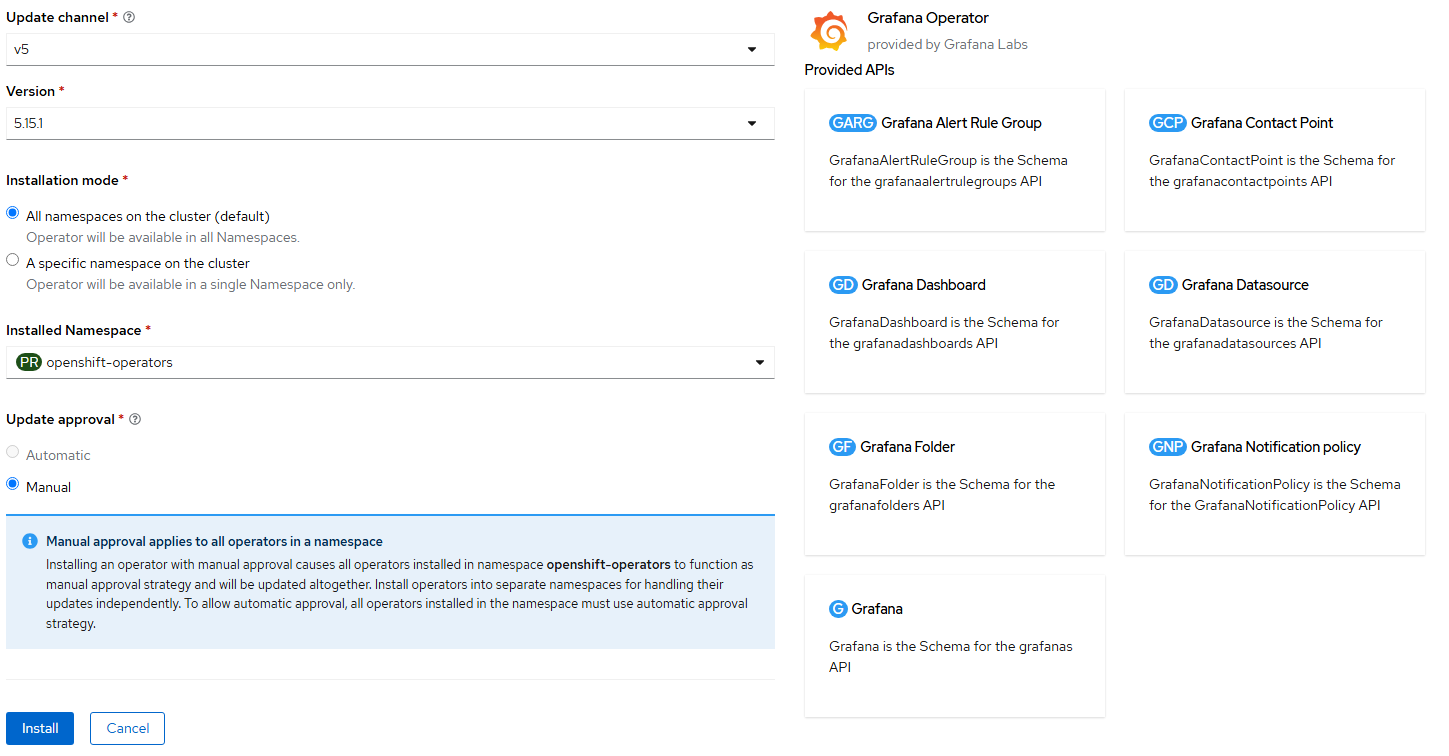
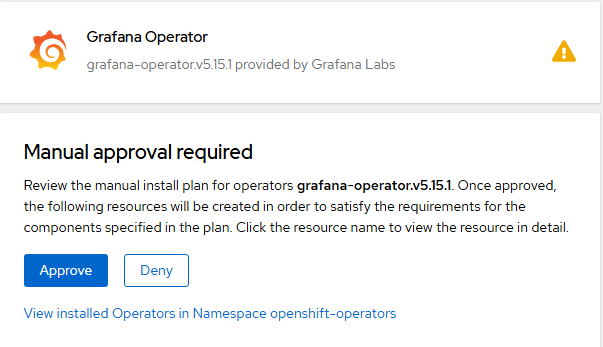
- You may get another message indicating that manual approval is required. This is because the operator is not set to automatically update by default. This is ok. Click "Approve".
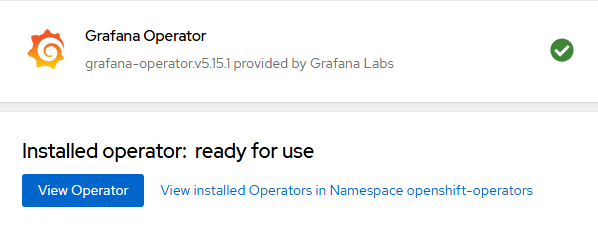
- Once the operator install is complete. Go to "View Operator".
- Create an instance of Grafana CRD. You may need to use the scroll-bar at top of the window and go all the way to the right.

On the resulting screen, click "Create Grafana".

- On this screen, click on YAML view radio button. Remove the contents and paste the following.
apiVersion: grafana.integreatly.org/v1beta1
kind: Grafana
metadata:
  labels:
    dashboards: grafana
    folders: grafana
  name: grafana
  namespace: grafana
spec:
  config:
    auth:
      disable_login_form: 'false'
    log:
      mode: console
    security:
      admin_password: password
      admin_user: root
  route:
    spec:
      tls:
        termination: edge
  version: 10.4.3
This code is also available at the following GitHub repo:
The username/password for the Grafana instance based on this example is root/password in this example but feel free to change.
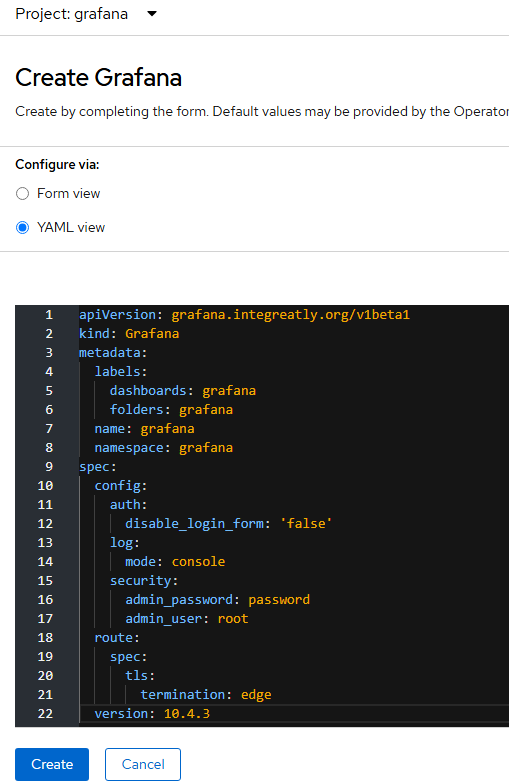
When done, hit "Create".
- The status of this object does not currently show in the GUI. To make sure it installed successfully, go to the YAML definition of this object and look at the status.

This says success so we are good to go.
- We now need to go to the grafana project and create a service account to allow access to the cluster Prometheus metrics. To do this on the command-line, run the following:
oc project grafana- Now, let's create a service-account, the cluster-role binding, and token.
oc create sa grafana-sa -n grafana
oc adm policy add-cluster-role-to-user cluster-reader -z grafana-sa
oc adm policy add-cluster-role-to-user cluster-monitoring-view -z grafana-sa
oc create token grafana-sa --duration=8760h
When you get the output from this command, copy and paste into notepad.
- Back in the Opensift Web Console, let's create a Grafana Datasource resource. Click "Create Grafana Dashboard". Go to YAML view and copy/paste this code:
apiVersion: grafana.integreatly.org/v1beta1
kind: GrafanaDatasource
metadata:
  annotations:
  name: grafanadatasource-prometheus
  namespace: monitoring
spec:
  allowCrossNamespaceImport: true
  datasource:
    access: proxy
    editable: true
    secureJsonData:
      httpHeaderValue1: Bearer <your token here>
    name: prometheus
    url: 'https://thanos-querier.openshift-monitoring.svc.cluster.local:9091'
    jsonData:
      httpHeaderName1: Authorization
      timeInterval: 5s
      tlsSkipVerify: true
    basicAuth: false
    isDefault: true
    type: prometheus
  instanceSelector:
    matchLabels:
      dashboards: grafana
  plugins:
    - name: grafana-clock-panel
      version: 1.3.0
  resyncPeriod: 5m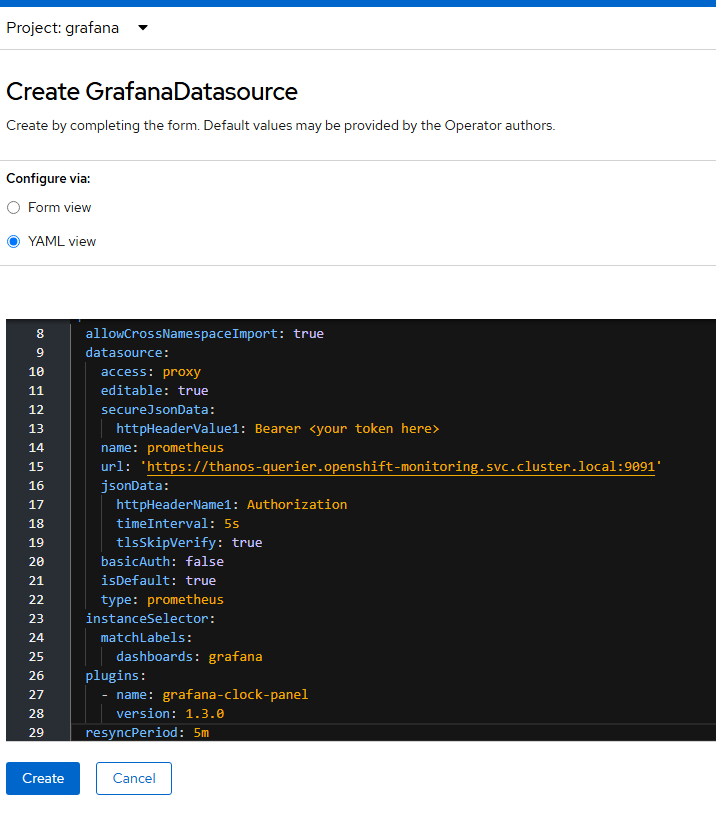
For the httpHeaderValue1 field, insert the token you copied and pasted previously right after Bearer as shown below.

Click "Create".
- Now, let's go to the Grafana GUI.
To view the route for Grafana GUI, run the following command:
oc get route -n grafana
It will be https://grafana-route-grafana.apps<yourclusterfqdn>
You may get a browser warning about certificate. You can proceed.
- I used root/password in my example to login
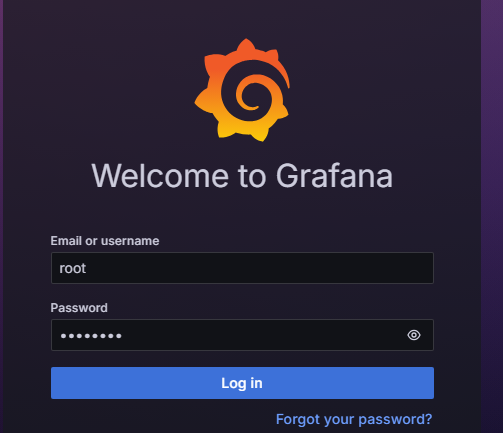
- Once logged into the GUI, click on Connections --> Data sources

You should see the data source we created.
- Now, let's add the dashboard information.
Click on the "Dashboards" menu on the left side of Grafana GUI.

Click, Create Dashboard"
Click "Import Dashboard"

Either download the following file to your desktop and upload or copy/paste the contents
In this example, I copied/pasted the code
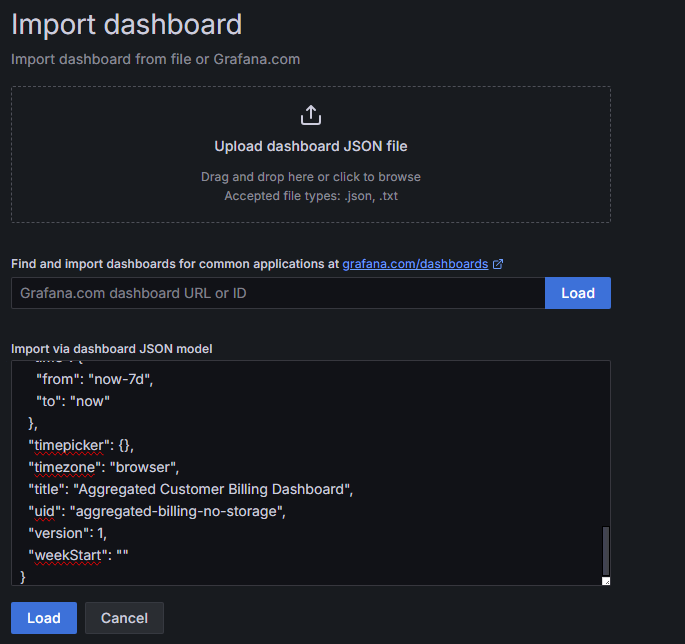
Click "Load" when finished.
On the resulting screen, click "Import"
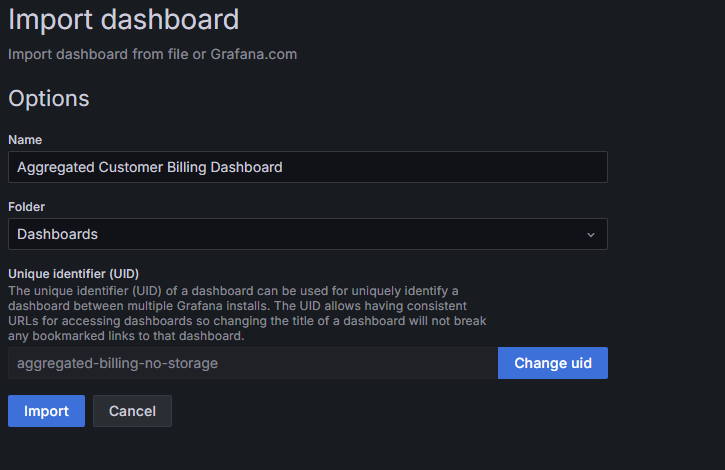
- Go to "Dashboards" on left-hand pane of Grafana GUI.
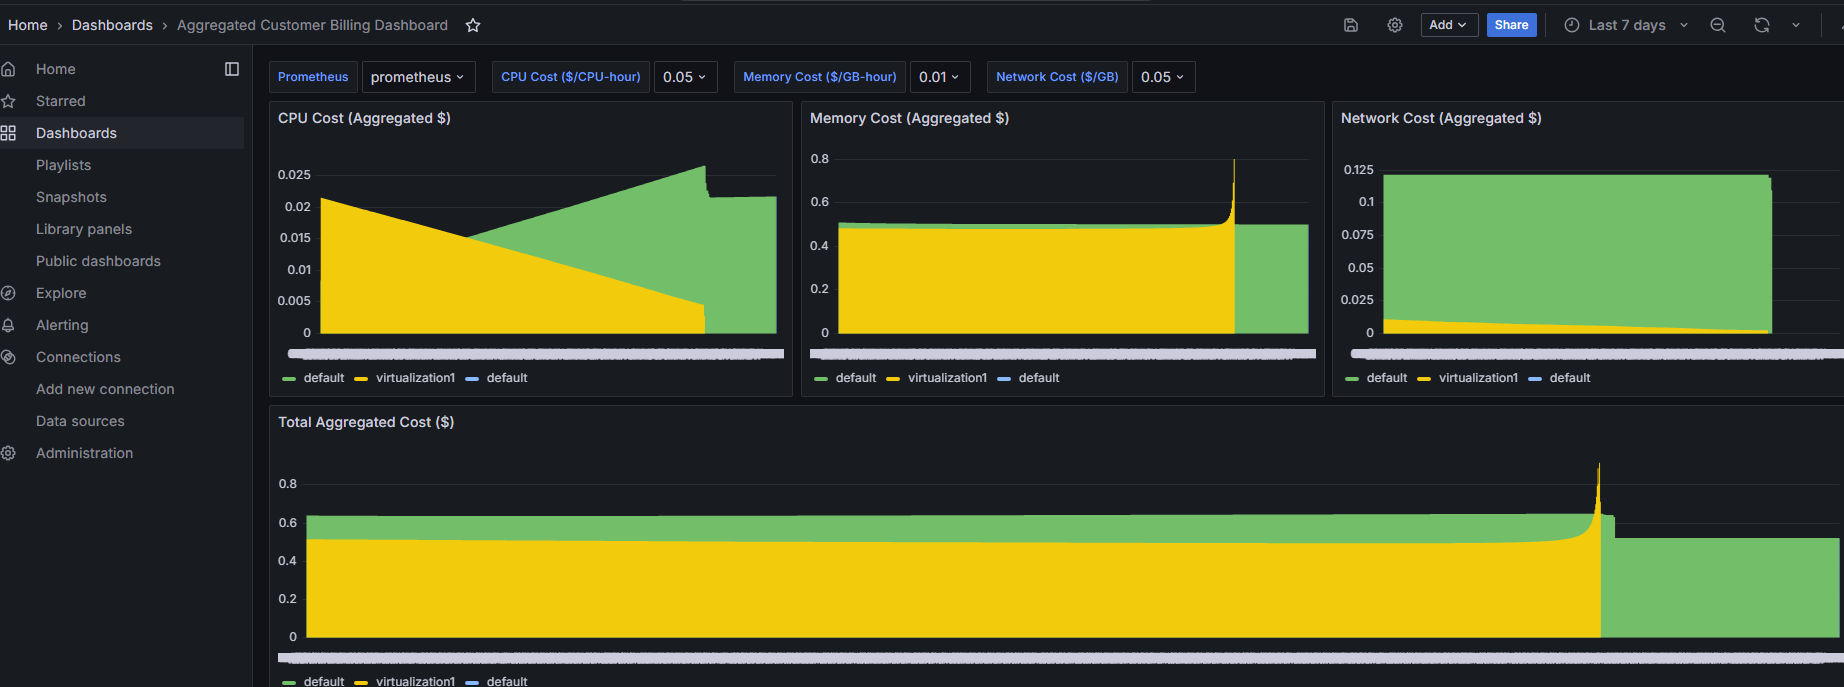
You will see a new dashbaord called "Aggregated Customer Billing Dashboard".
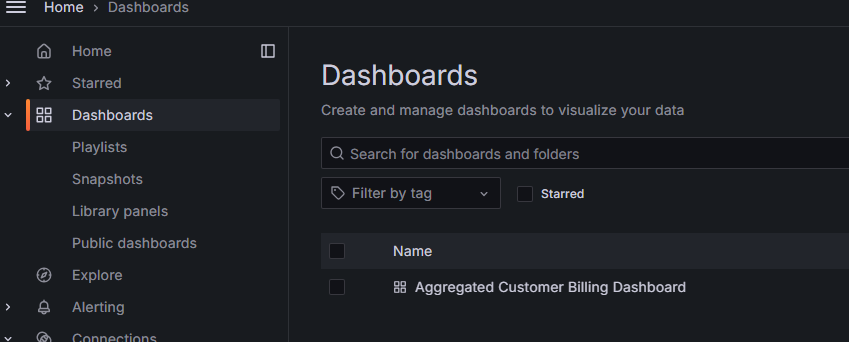
Click on the dashboard name.
You will see some sample data.
The Prometheus Metrics/Calculations
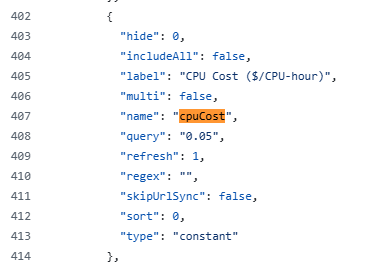
The example has the following Prometheus queries enabled. All of these are set to charge at 5 cents an hour by default.
This is set in line 408 of the billing.json file
CPU Cost
Line 101 of billing.json
"sum by (namespace)( increase(kubevirt_vmi_cpu_usage_seconds_total[$__range]) ) / 3600 * $cpuCost"Memory Cost
Line 108 of billing.json
"sum by (namespace)( avg_over_time(kubevirt_vmi_memory_used_bytes[$__range]) ) * $__range_s / 3600 / (1024*1024*1024) * $memoryCost"Network Cost
Line 275
"( sum by (namespace)( increase(kubevirt_vmi_network_receive_bytes_total[$__range]) ) + sum by (namespace)( increase(kubevirt_vmi_network_transmit_bytes_total[$__range]) ) ) / (1024*1024*1024) * $networkCost"Total Aggregate Cost
Line 362 of billing.json
"(sum by (namespace)( increase(kubevirt_vmi_cpu_usage_seconds_total[$__range]) ) / 3600 * $cpuCost)\n+ on(namespace) group_left()\n(sum by (namespace)( avg_over_time(kubevirt_vmi_memory_used_bytes[$__range]) ) * $__range_s / 3600 / (1024*1024*1024) * $memoryCost)\n+ on(namespace) group_left()\n(\n (\n sum by (namespace)( increase(kubevirt_vmi_network_receive_bytes_total[$__range]) )\n + sum by (namespace)( increase(kubevirt_vmi_network_transmit_bytes_total[$__range]) )\n ) / (1024*1024*1024) * $networkCost"This gives you an idea on what you can do on your own but it is probably a lot easier to use our Cost Management Metrics Operator. Another blog on this will be posted shortly.


