Cost Management Metrics Operator
In this next post, I wanted to continue based on some of the previous articles I wrote that were specific to Openshift Virtualization.
Most specifically, this article:

In that blog, I covered how to create your own billing dashboard but here I will use the Openshift supported one. The Cost Management Metrics Operator automatically ships off metrics which are displayed on the main console.redhat.com site. The previous post was meant to show you the flexibility that you have to create your own dashboards but the preferred/supported way is based on the article you are reading now.
Even in disconnected/air-gapped mode, the Cost Management Metrics operator' reports can be bundled up and manually uploaded.
More information including official documentation can be found here:

Installing the Cost Management Metrics Operator
- On the Openshift web console, go to Operators --> OperatorHub
Search for "Cost Management"
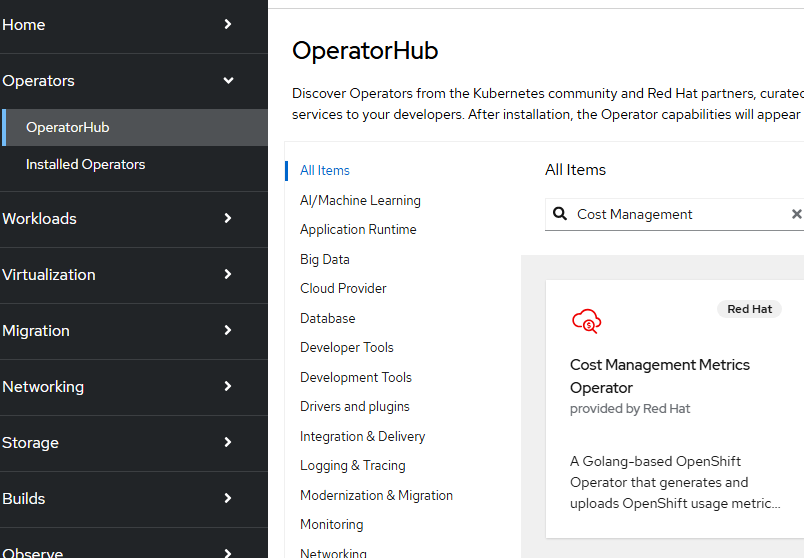
Click on the "Cost Management Metrics Operator" provided by Red Hat
- Accept the defaults and click "Install" on the first screen.
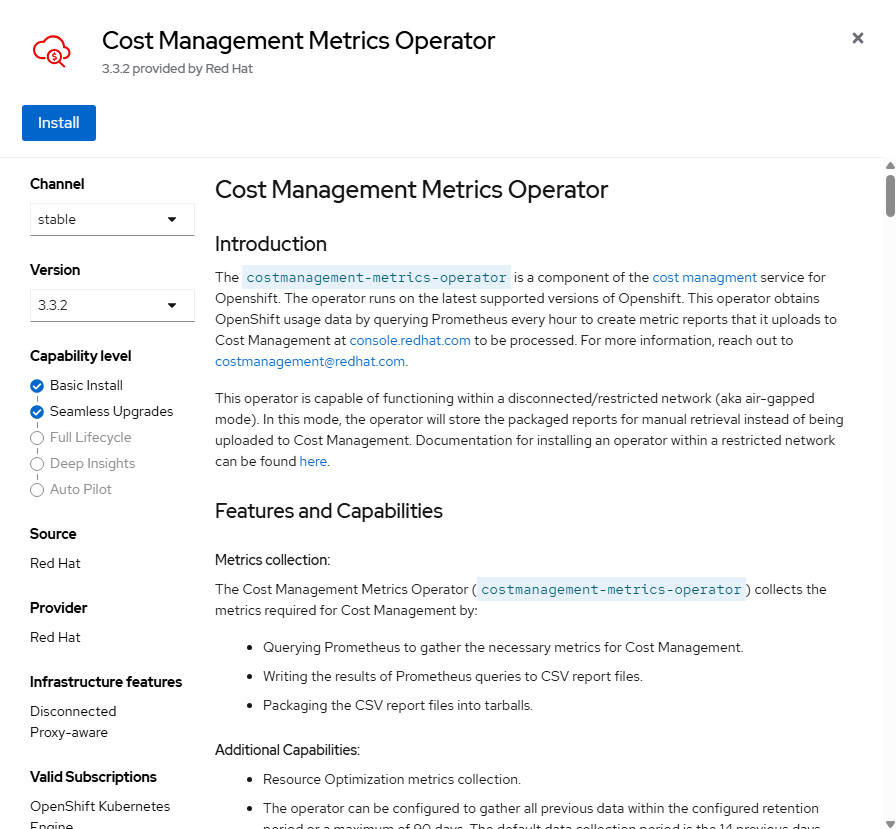
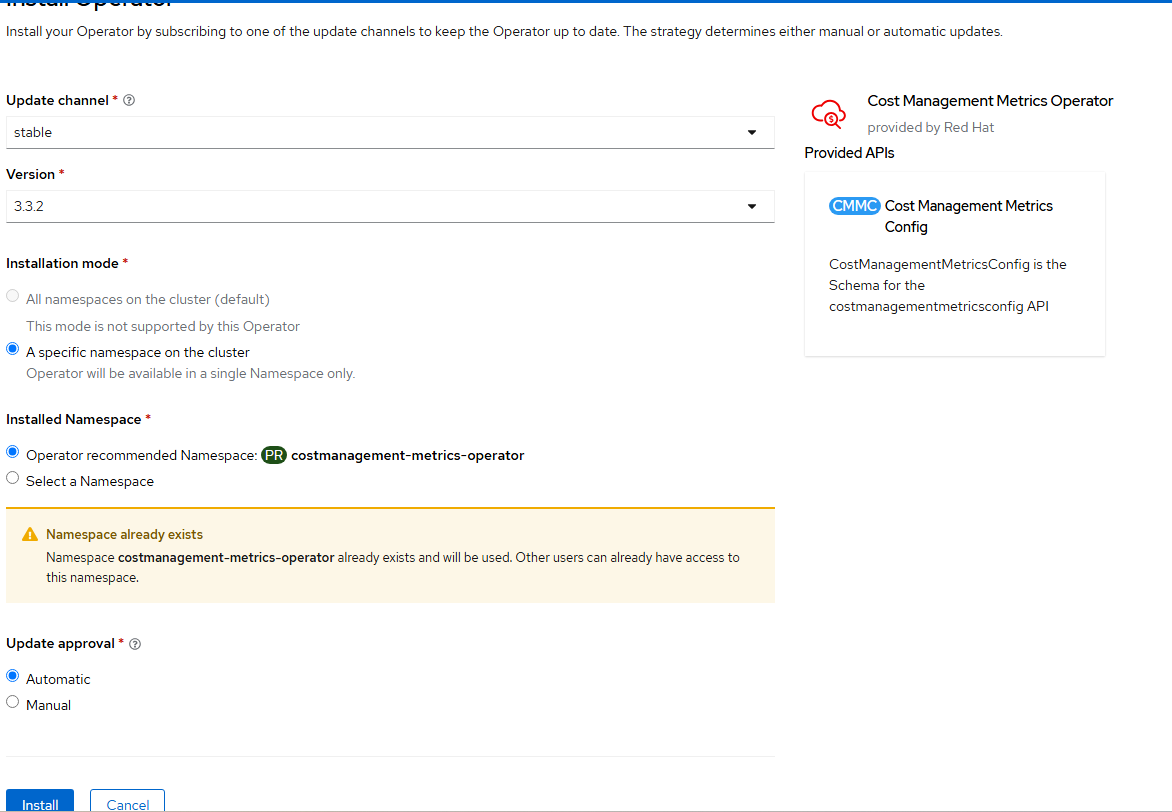
Click "Install" again.
- When the operator is finished installing, click "View Operator".
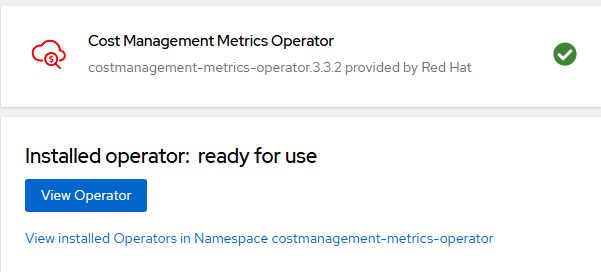
- Now, let's create the configuration object. Go to the "Cost Management Metrics Config" tab.

- I'm accepting the defaults for this one. Click "Create".
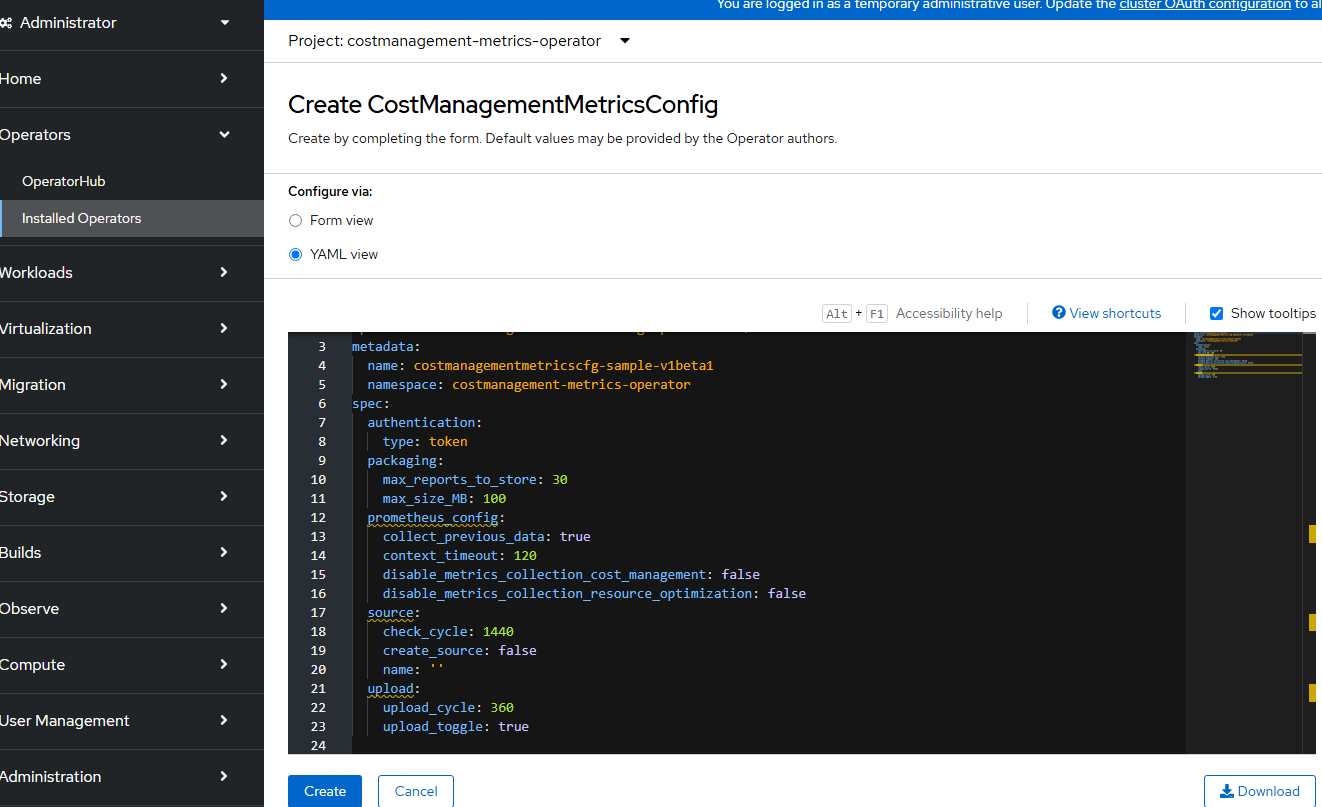
Viewing the Data
When the data is uploaded to console.redhat.com,
- Login to console.redhat.com
- Once logged-in, you will see a menu similar to the following:
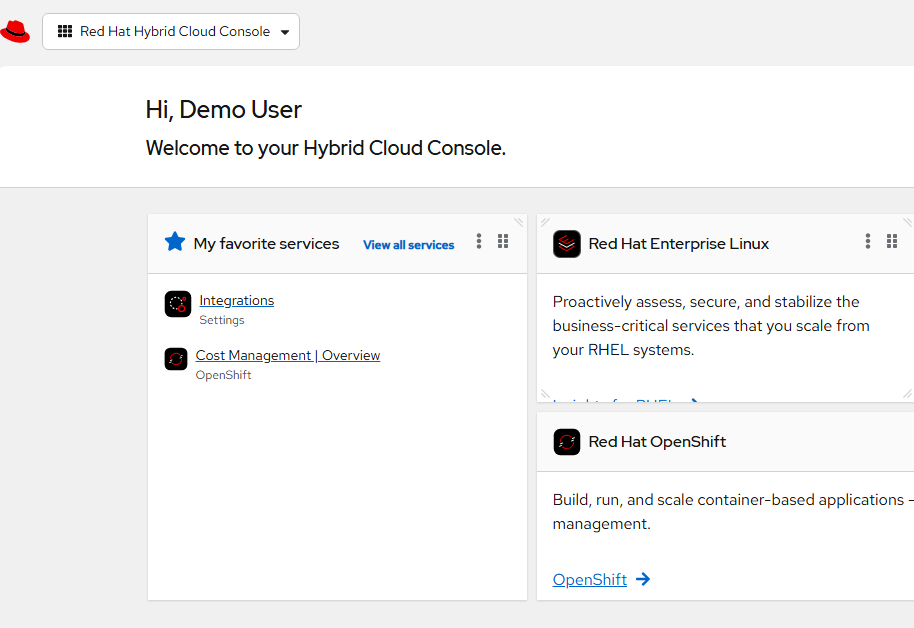
Click on "Cost Management| Overview" link.
- By default, the "Overview" screen will appear.
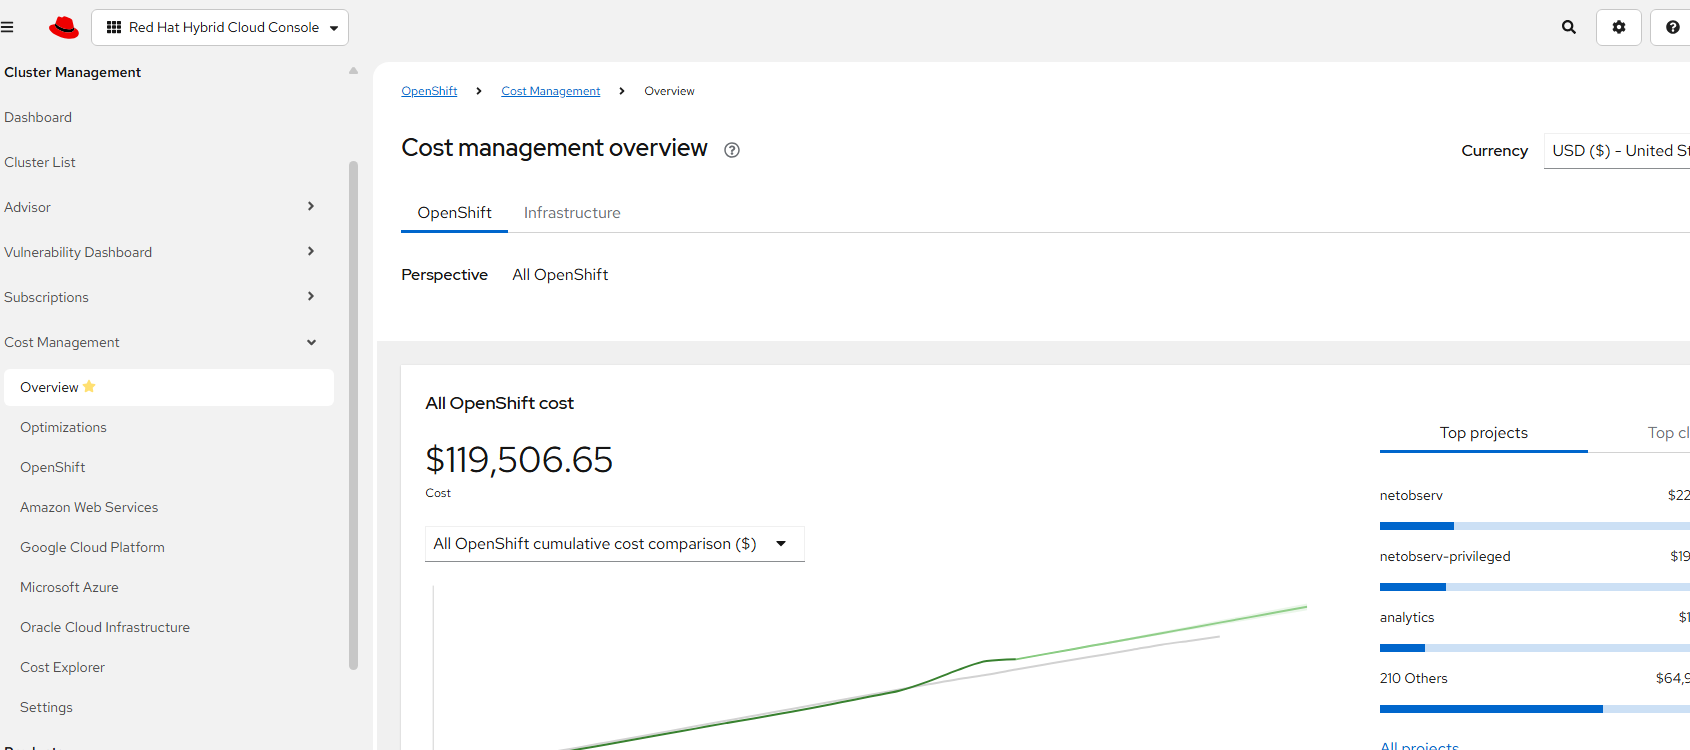
This allows you to view the total cost (amount for customers to be billed) for the last 31 days by default. These costs are based on the pricing that is supplied in the pricing model which will be shown in the next step.
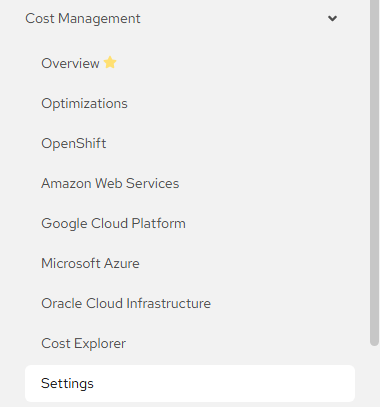
- Go to Settings under the Cost Management section in the left pane as shown below.
- Let's create a "Cost Model"
Click "Create cost model"

- On the next screen, you will assign a name, description, the integration (this will be for bare-metal OCP) and will use USD (dollars).
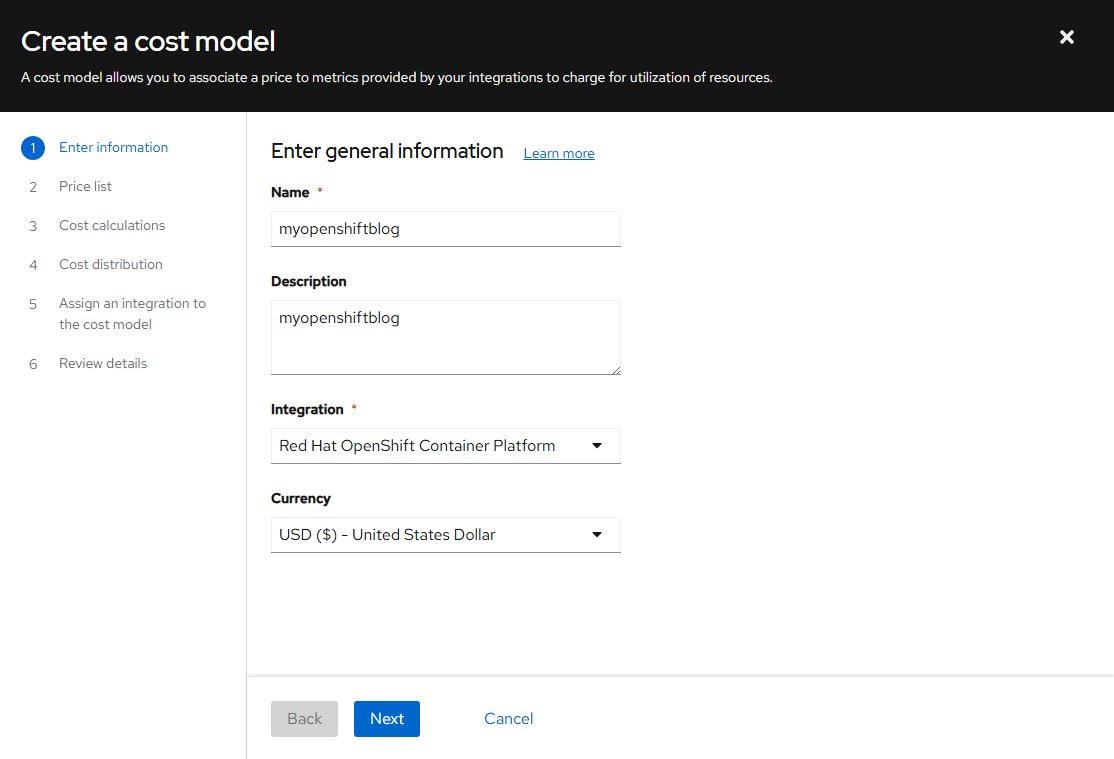
Hit "Next"
- On the next screen, click "Create rate"
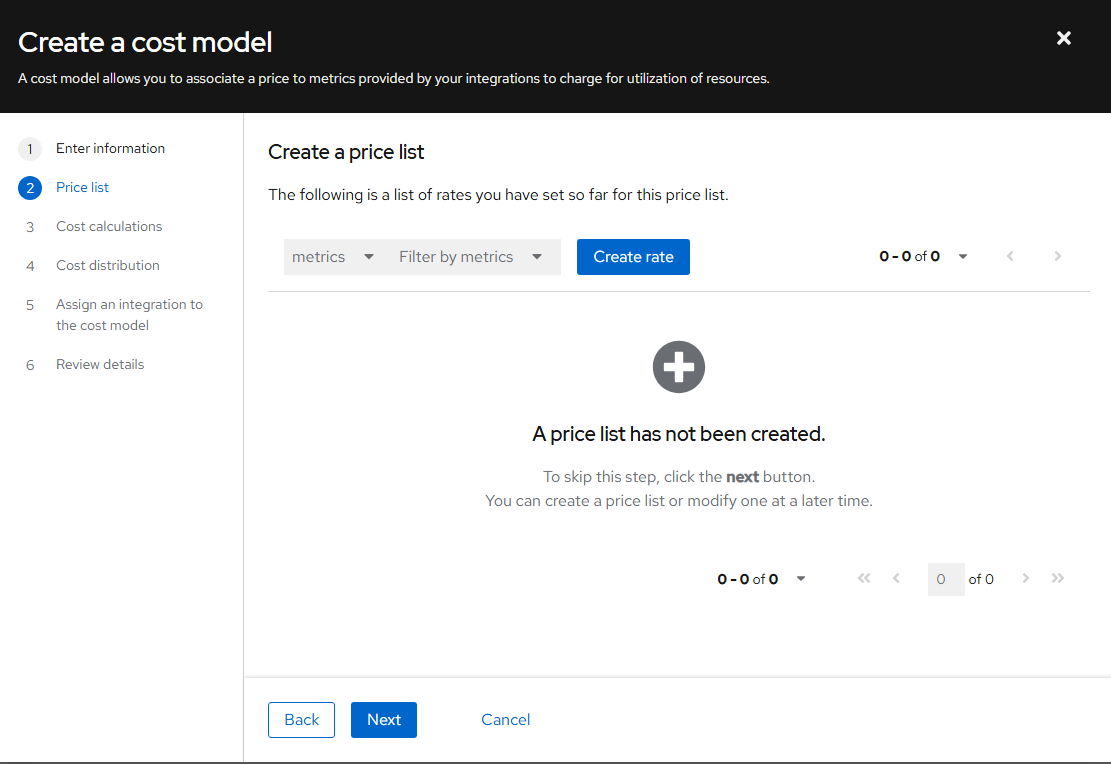
We can add some pricing based on metrics such as CPU, Memory, Storage, Node, and Cluster as shown below.
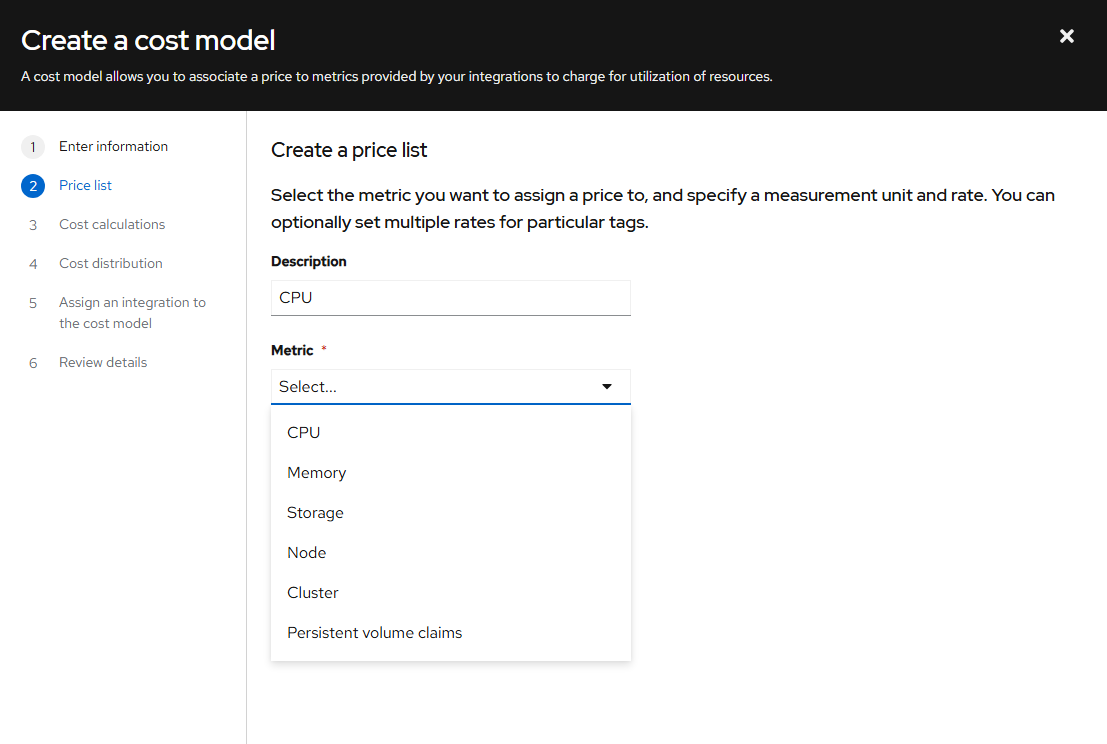
For this example, let's use CPU
On the right-hand side, you can select how you will handle your billing as shown below
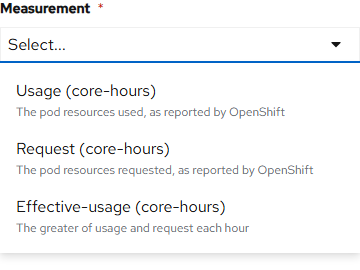
You can select any of these you would like for now. I chose "Effective Usage (core-hours)
For calculation type, Infrastructure or Supplementary are listed.

Here is a chart showing how the these types of costs are typically handled.
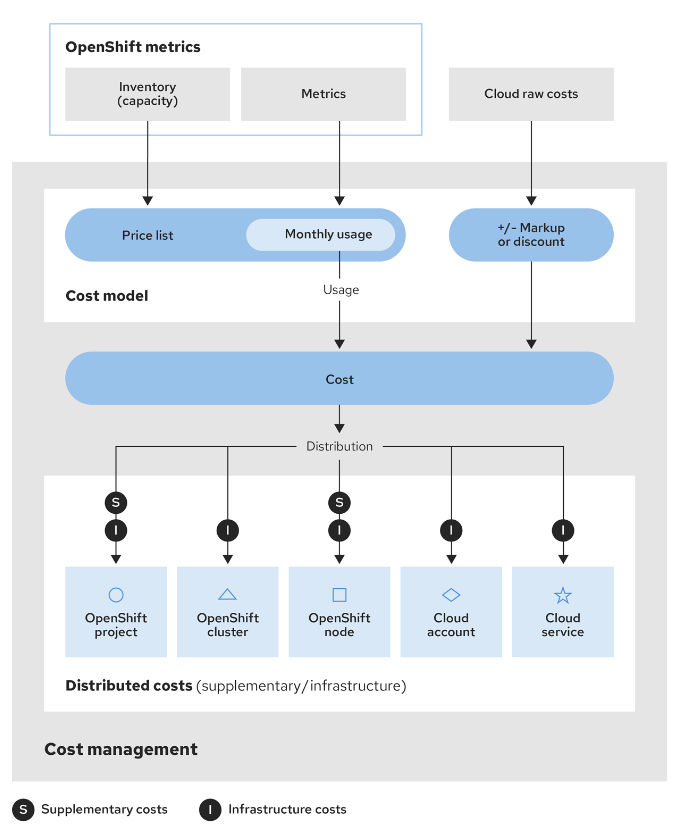
Here is another definition:
- Infrastructure: Covers the core foundational costs that are necessary for running OpenShift and its workloads.
- Supplementary: Encompasses costs for added services, tools, and capabilities that enhance the functionality of OpenShift but are not part of the core infrastructure.
I picked 5 cents for the rate
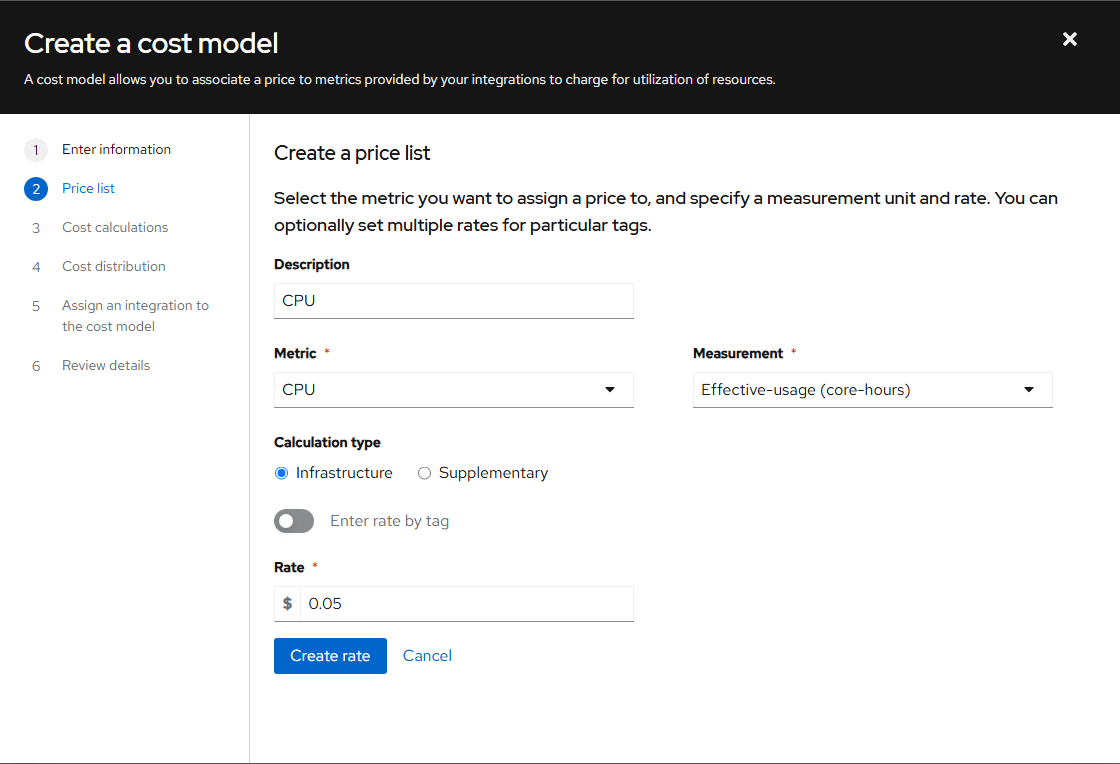
Click "Create rate"
You will now be taken back to the main screen where you can add pricing for the other types of resources. In this example, I will not do each of these for time sake.
- The next screen determines how you will handle costs when you need to pay for other infrastructure such as AWS, Google, Azure, etc. We can skip this for now.
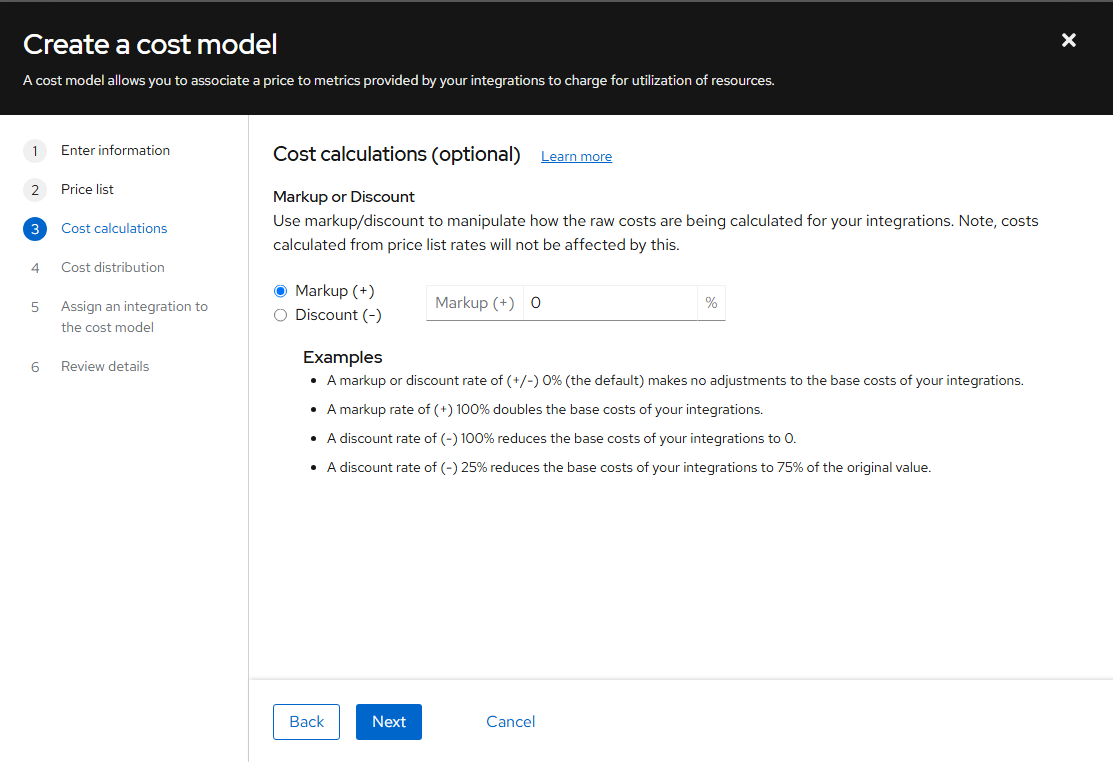
Click "Next"
- This next screen by default will include all of these costs to the project/tenant as shown below.
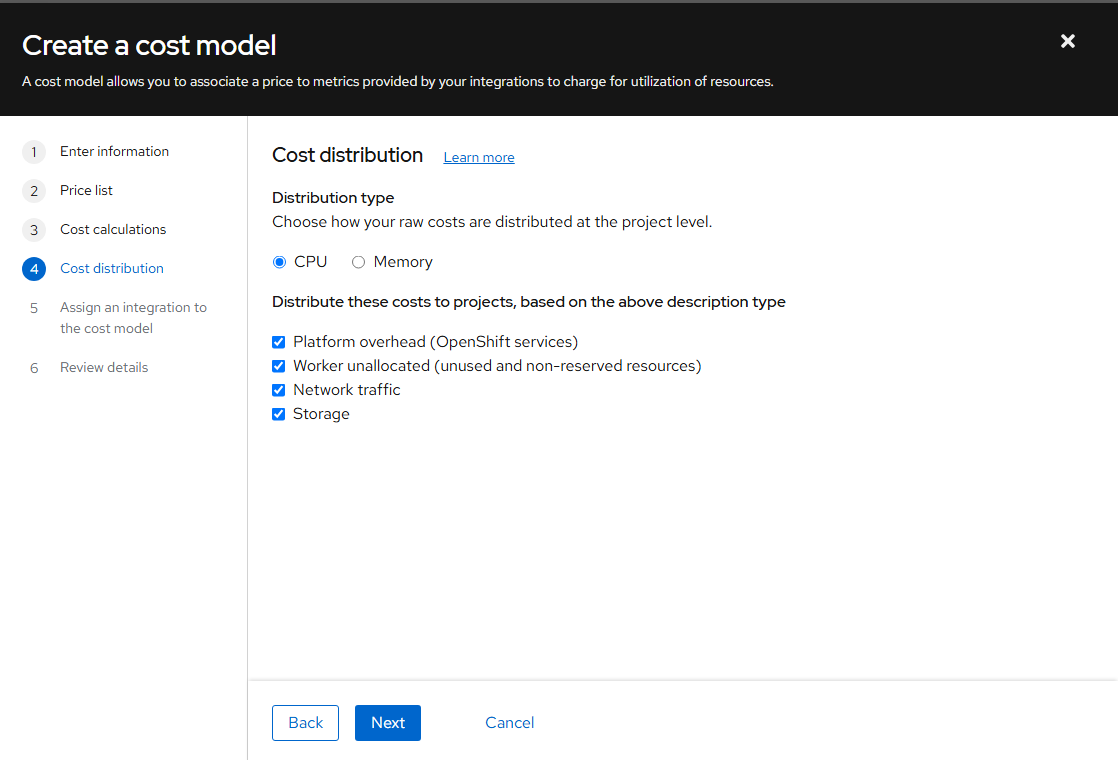
- No integrations will be tied to this currently due to the way my demo account is setup. Your view may be slightly different from the view shown here.
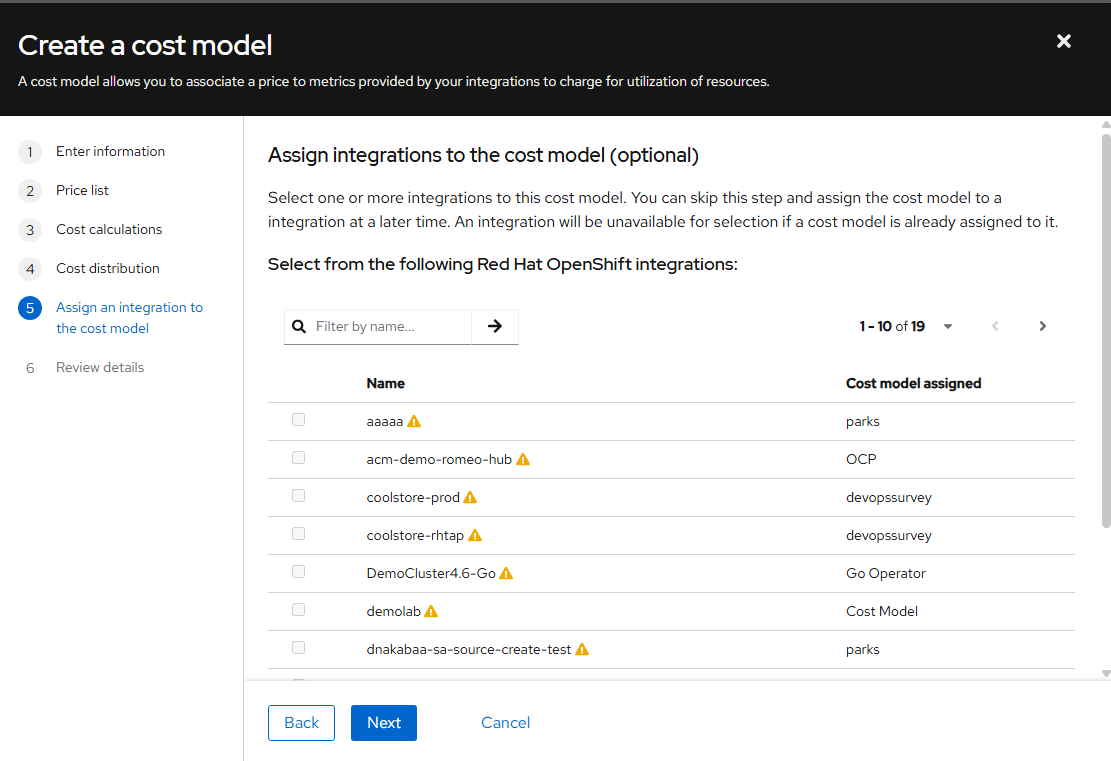
Click "Next"
- Click "Create" on the final confirmation screen.
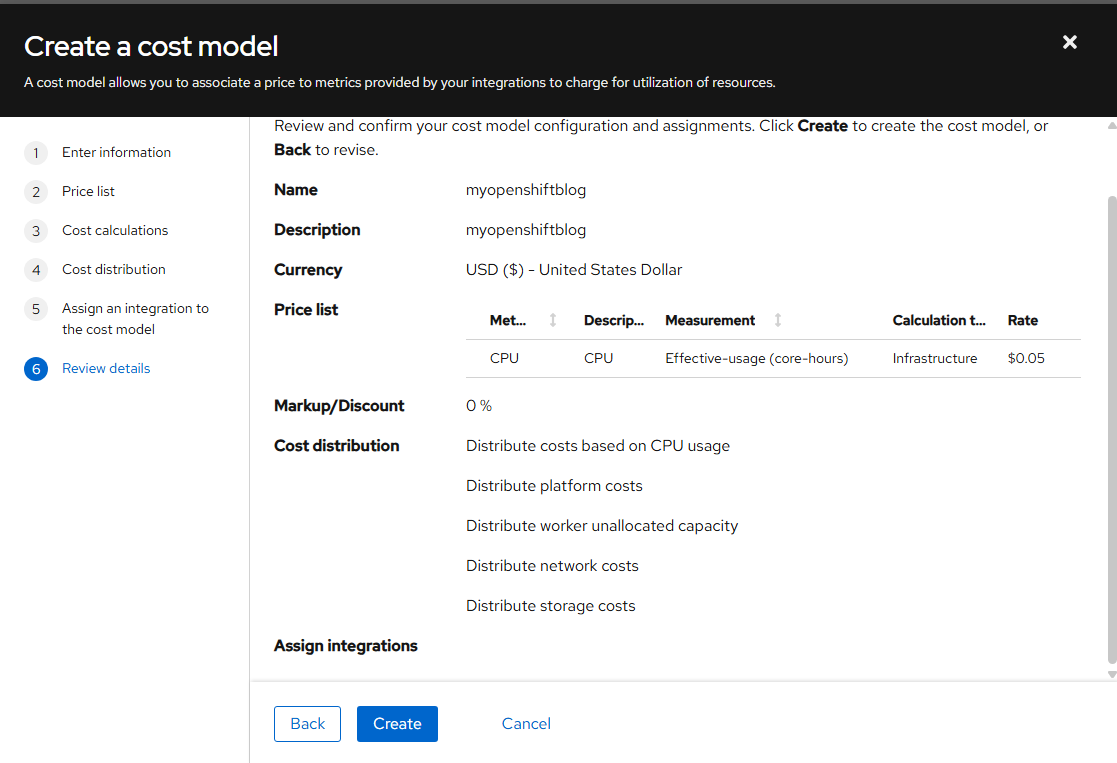
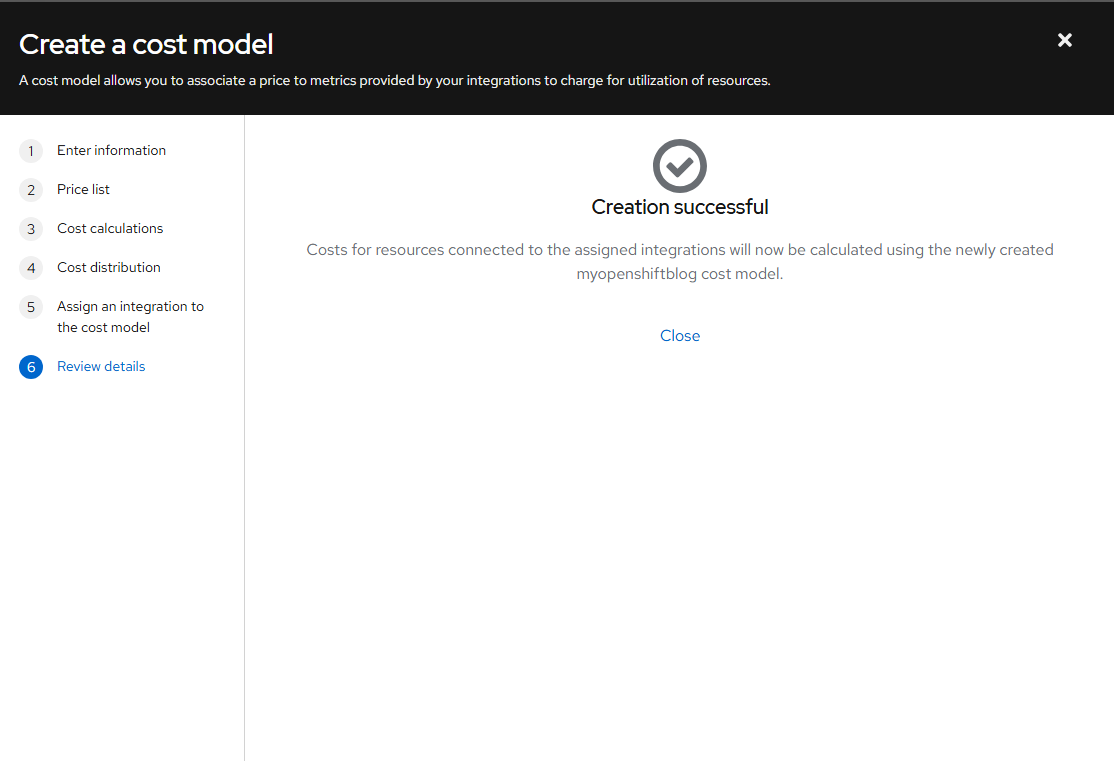
Close the resulting screen.
- Some other menu items appear that are customizable such as adding labels, cost categories, and platform projects. We will skip this part for now.
Cost Management Overview Screen
Here is a display of this screen again
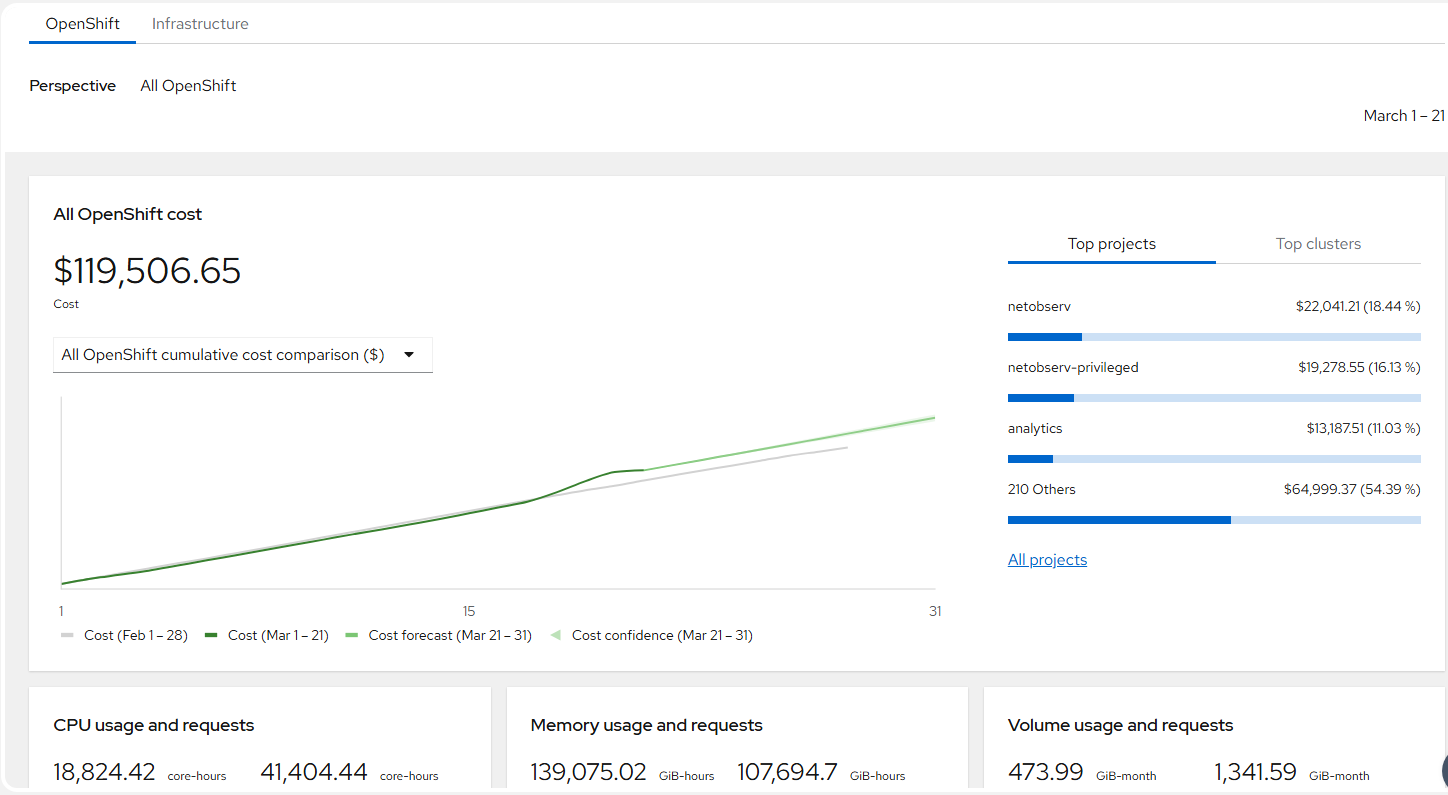
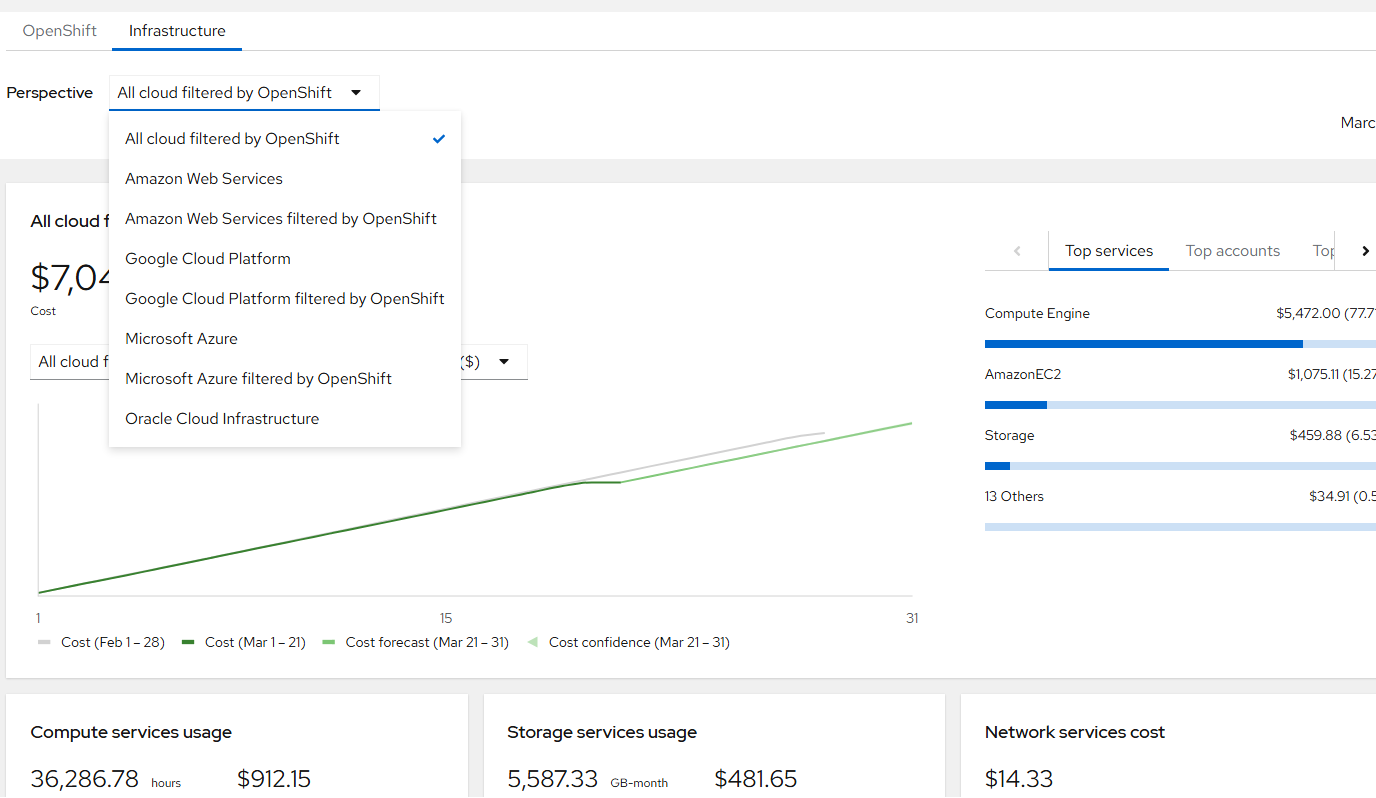
By default the perspective will be set to all charges. If you go to Infrastructure tab, can view your overhead charges if you are using a cloud provider.
AWS, GCP, Azure, and Oracle cloud show up here if you use these providers for your OCP infrastructure.
Cost Management Optimizations Screen
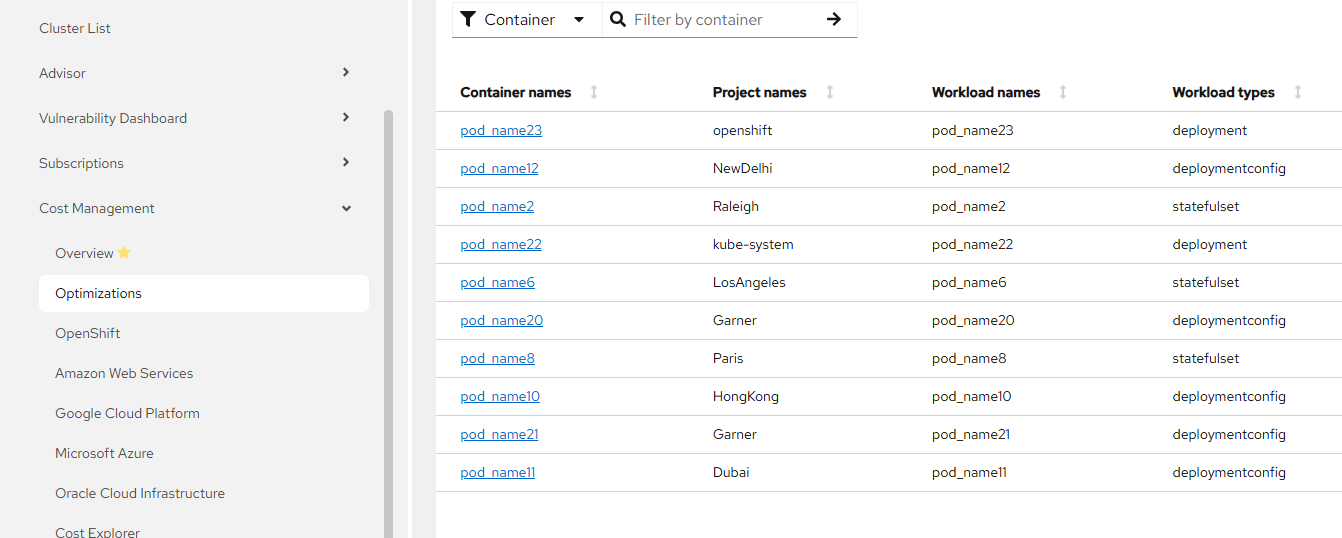
In here, you can see recommendations to reduce costs. In this example, let's click on pod_name23. Costs tab attempts to save money while performance will tell you if there's a bottle-neck.
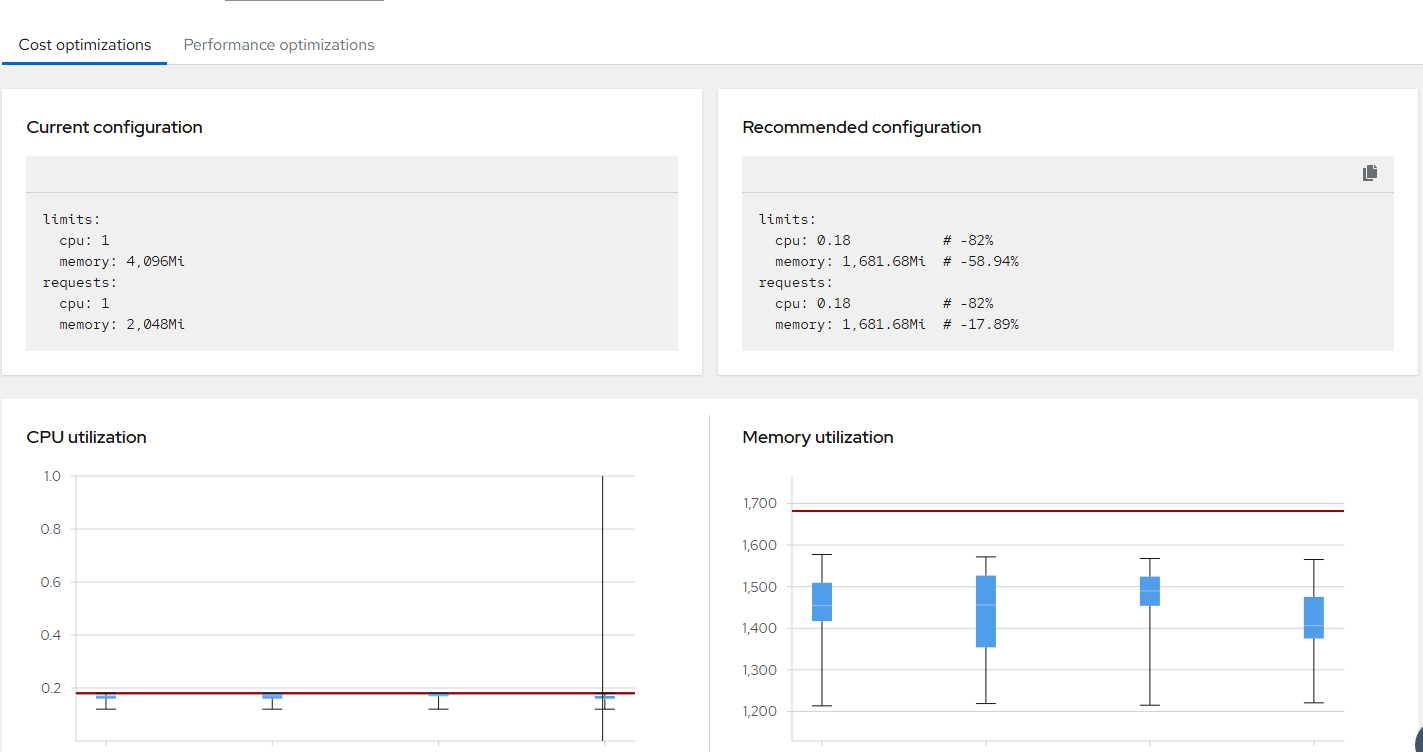
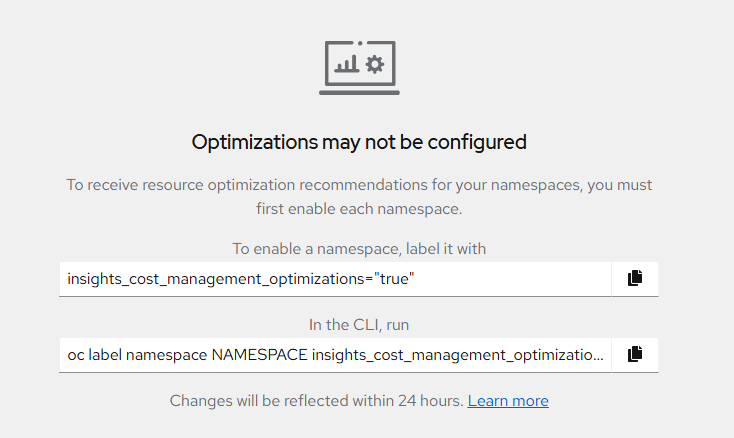
Here is how to enable detection of optimization recommendation based on your project.
Openshift Details Screen
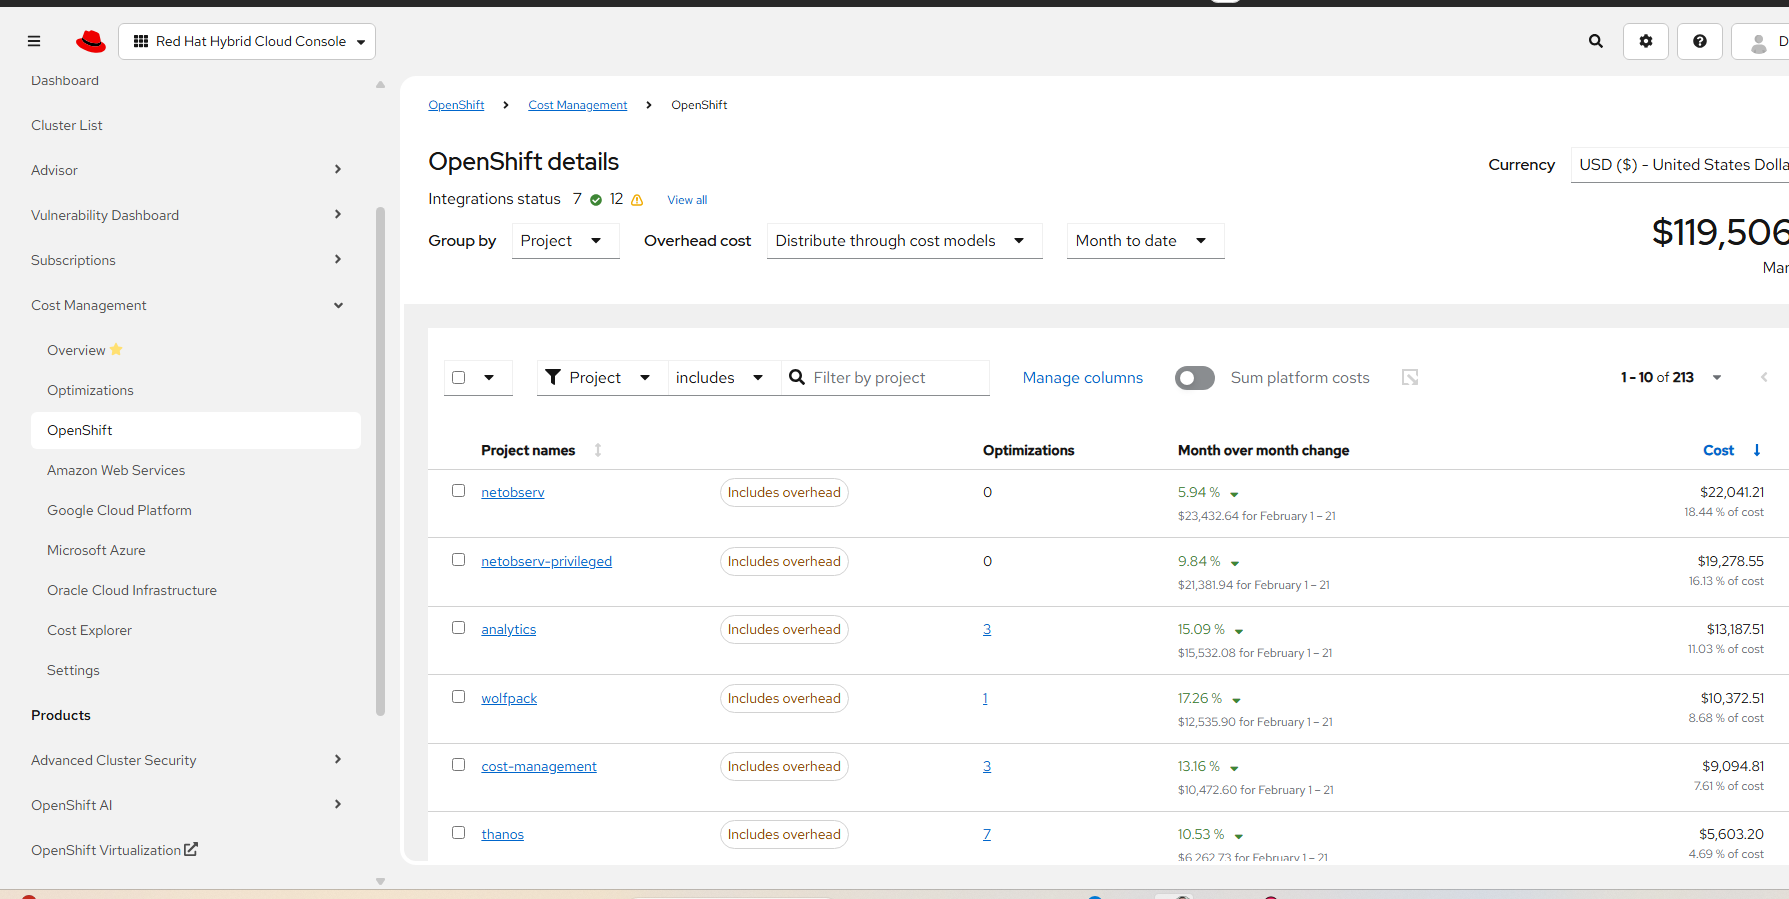
On this screen, the view can be grouped by cluster, node, project (default) or label.
Month-to-date or previous month information can be viewed here as well.
You can show the cost on whether it is a distributed cost or if costs are not distributed. The different costs will show up based on this.
Let's click on the "netobserv" project or something else that is visible in your environment.
Project Details Screen
This is the main screen you will see or something similar.
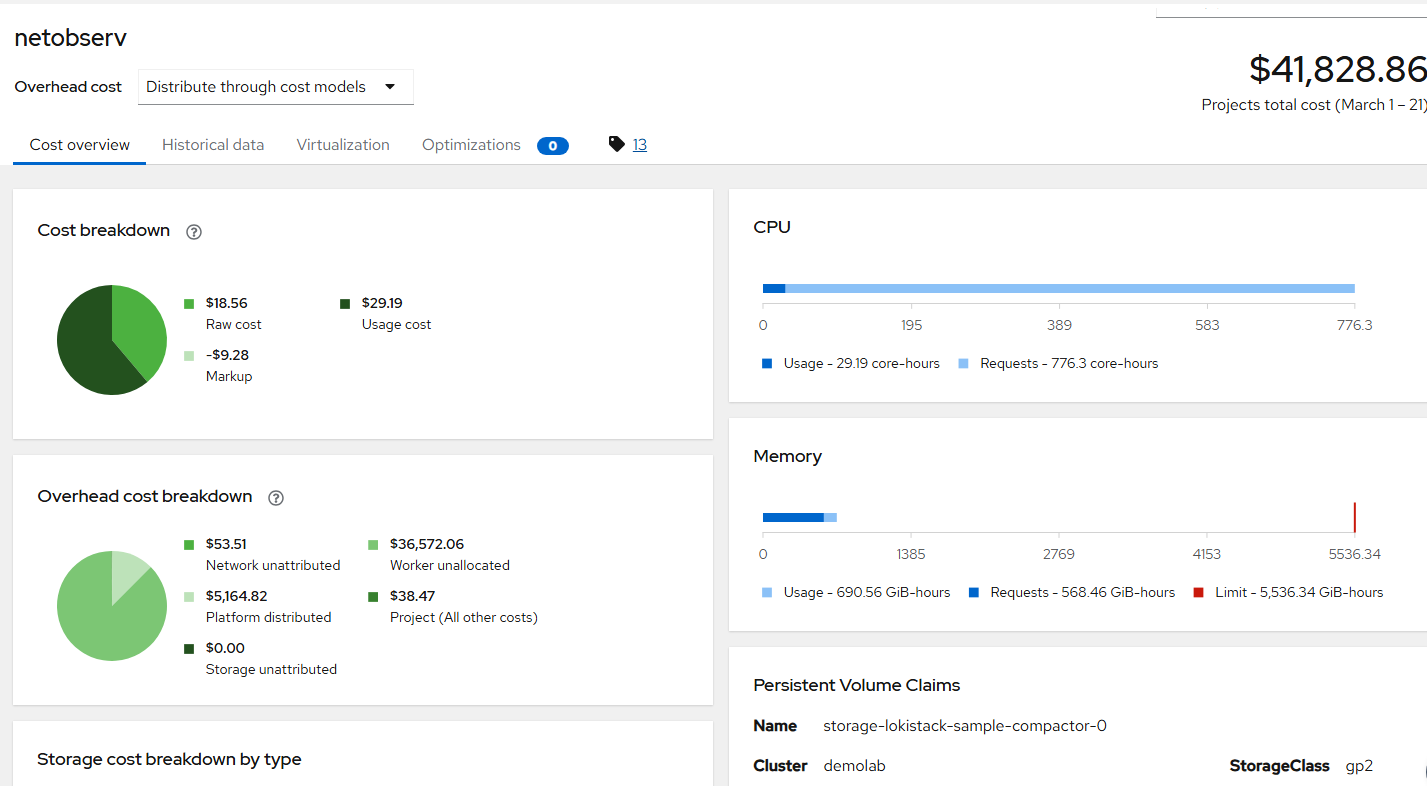
Total cost specific to this project is $41,828.86 in the current month (March 1st through the 21st) and the cost is distributed.
There is cost breakdown which shows a cost breakdown by raw cost, markup, and usage.
For the overhead cost breakdown, there is a list of resources that may be underutilized (or unused) and how much this is costing.
Here are some of the other views
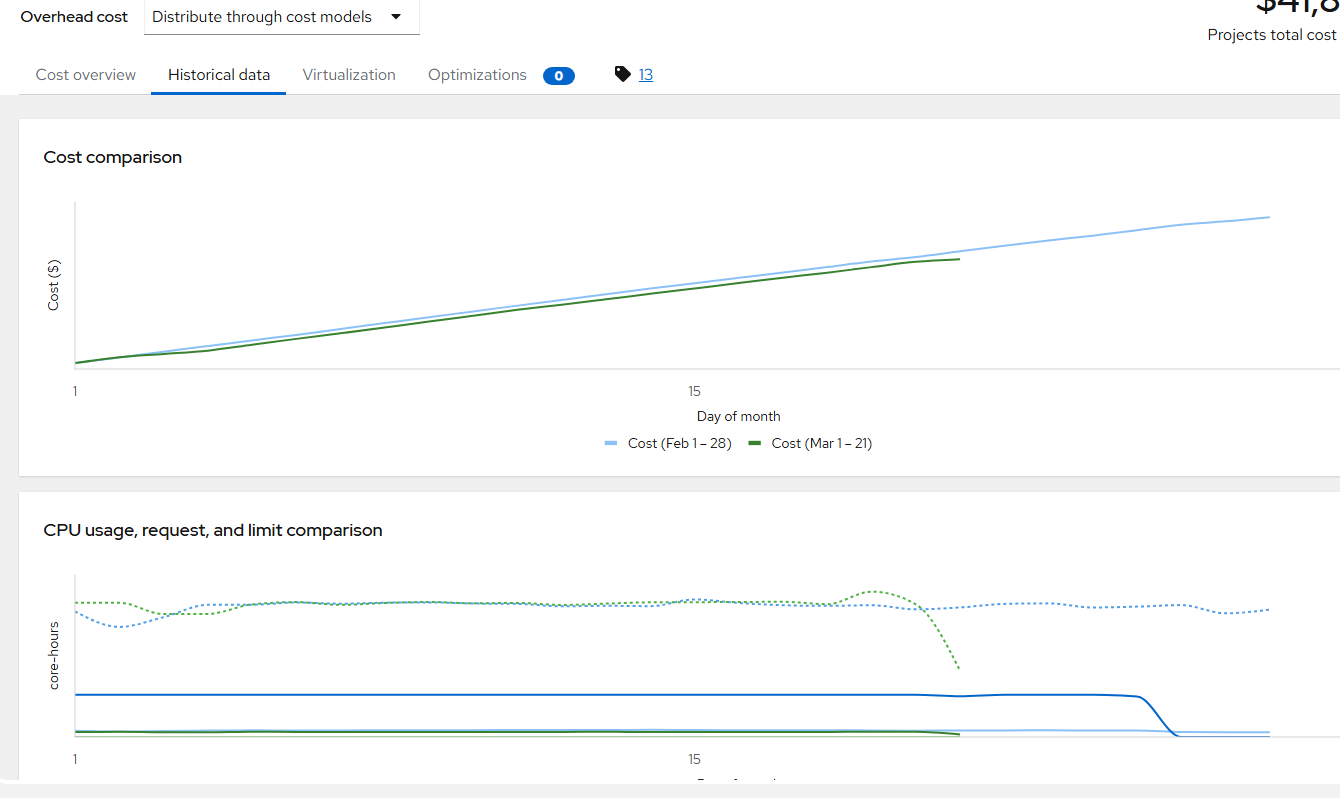
Historical Data
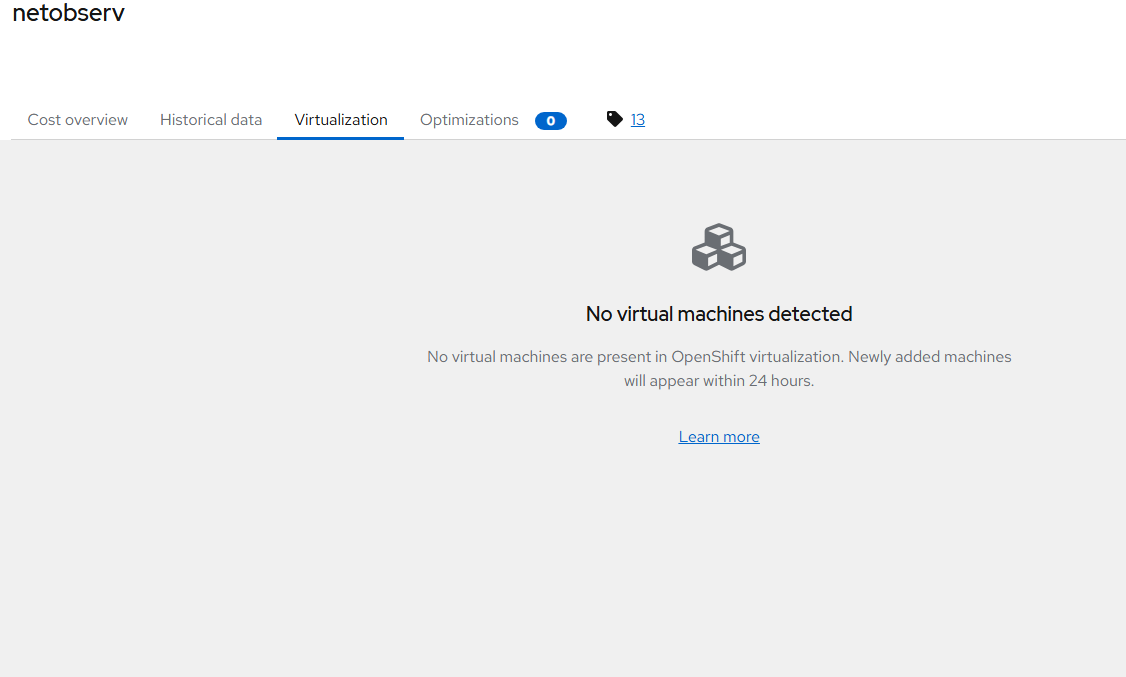
Virtualization
There are no virtual machines in my demo environment but you can drill-down for more details if this is enabled in your environment.
This was just a high-level overview but hope it is enough to get you started.
