
ACM, GitOps, and ZTP Walkthrough (Demo Day 2)
Now, I will go through the ACM menus. This is very similar to what I've done in the past but an update is in order as some menus changed, new features added, and I have some new demos available.
This article will be broken down into sections based on the different menus as shown below.
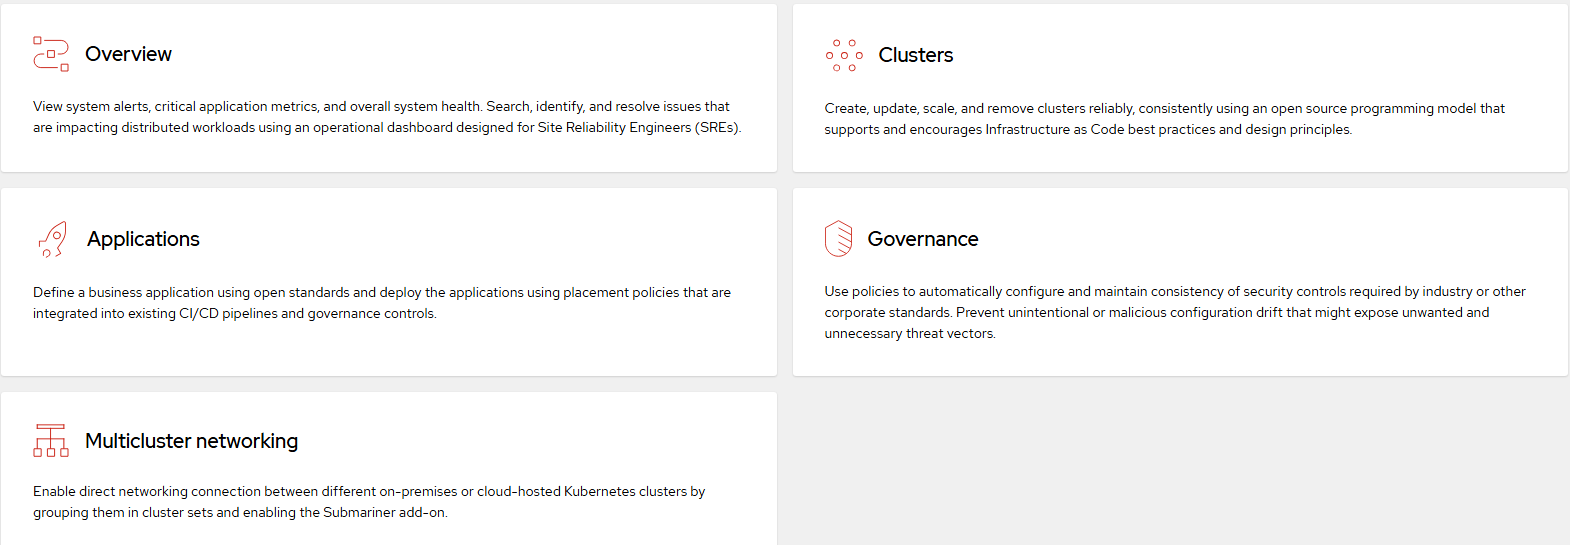
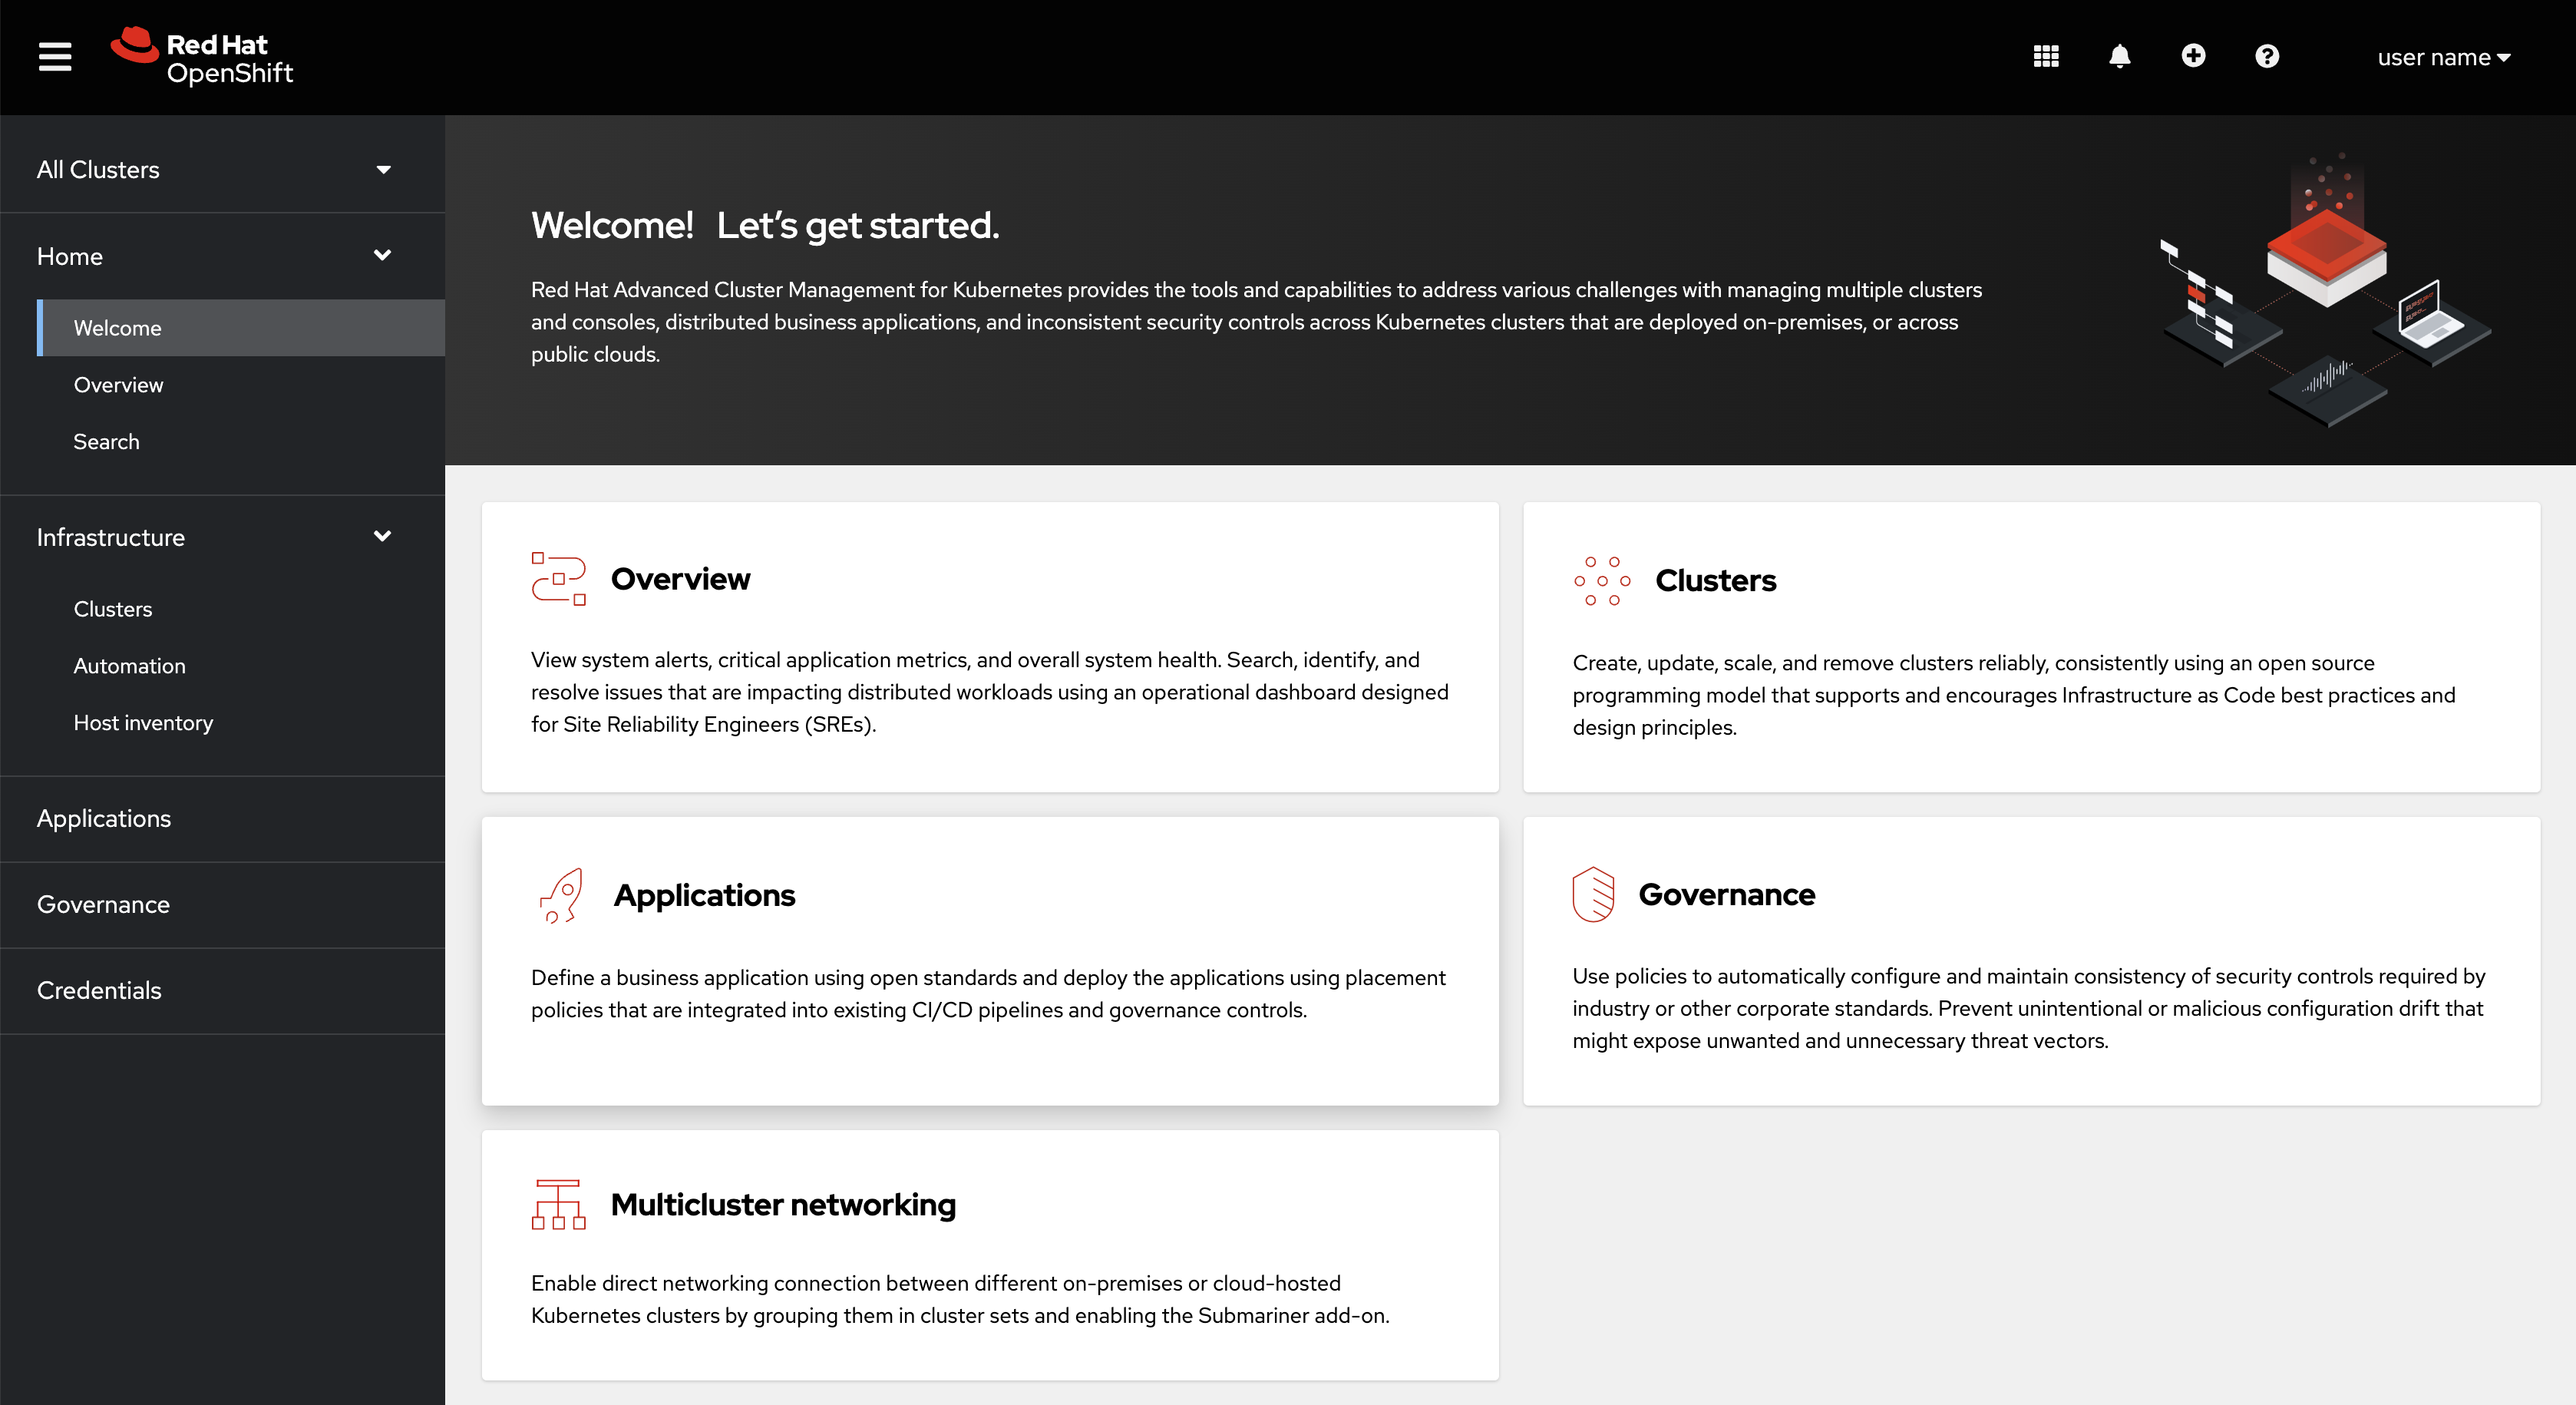
Overview
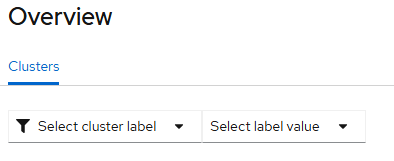
In the top part of the overview page is an overview that shows information about the clusters that are currently managed by this instance of ACM (Advanced Cluster Manager).
At the upper-left corner of this screen is a menu that can be used to filter clusters that show up in this view based on a label.
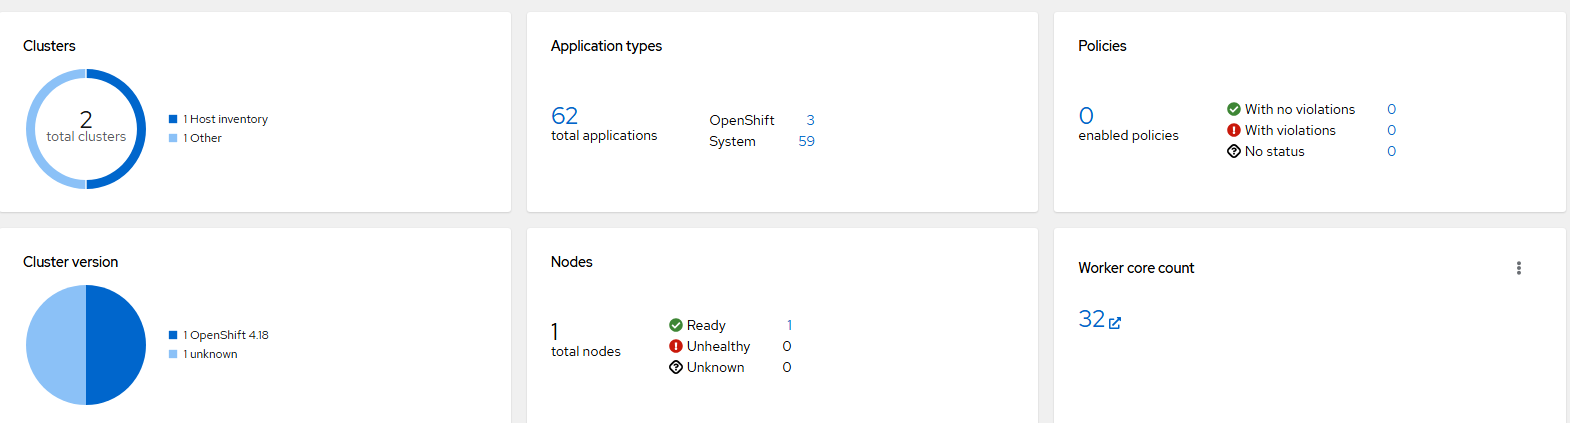
In the "Clusters" tile, there are 2 clusters showing. 1 using host inventory (I will explain this more soon) and the other was built using the assisted installer/bare-metal. Clicking on the "host inventory" or "other" label will take you to a filtered page showing the clusters that match this.
The "Application Types" tab shows that there are 62 applications running across all managed clusters. By clicking on the number next to the "Openshift" or "System" label will show you the workloads/applications that are running on the managed clusters (the hub/local cluster and all others).
"Policies" can be security-related or configuration settings that you want to be applied to managed clusters. Applications and policies can target one or many clusters based on labels. For example, you may only want to apply a specific Oauth type on certain clusters and not others. Maybe for production systems, this uses your enterprise Active Directory/LDAP but your test environment is based on htpasswd. There are no policies applied at the moment but a further explanation and examples of this will be provided shortly.
"Cluster version" breaks down the clusters based on the version of OCP they are running.
"Nodes" shows the total number of OCP nodes across all managed clusters.
"Worker core" count shows the total number of cores across all managed cluster nodes.
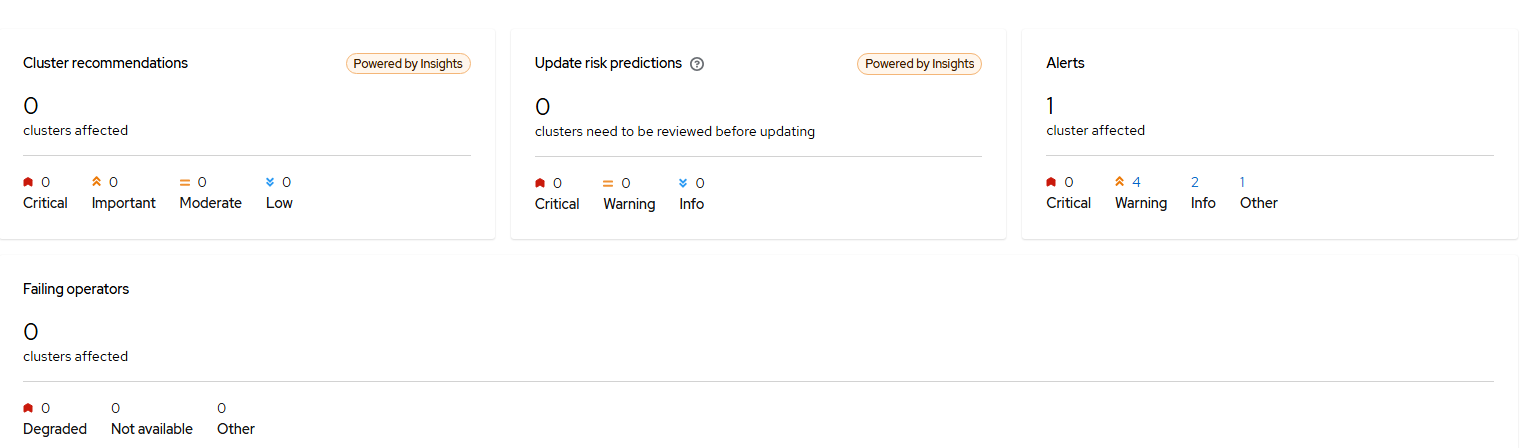
The next set of tiles are recommendations for your clusters based on telemetry data that is sent for connected clusters to Red Hat. These are indicated by the "Power by Insights" designation. The alerts show alerts from alert manager that are firing from the managed clusters.
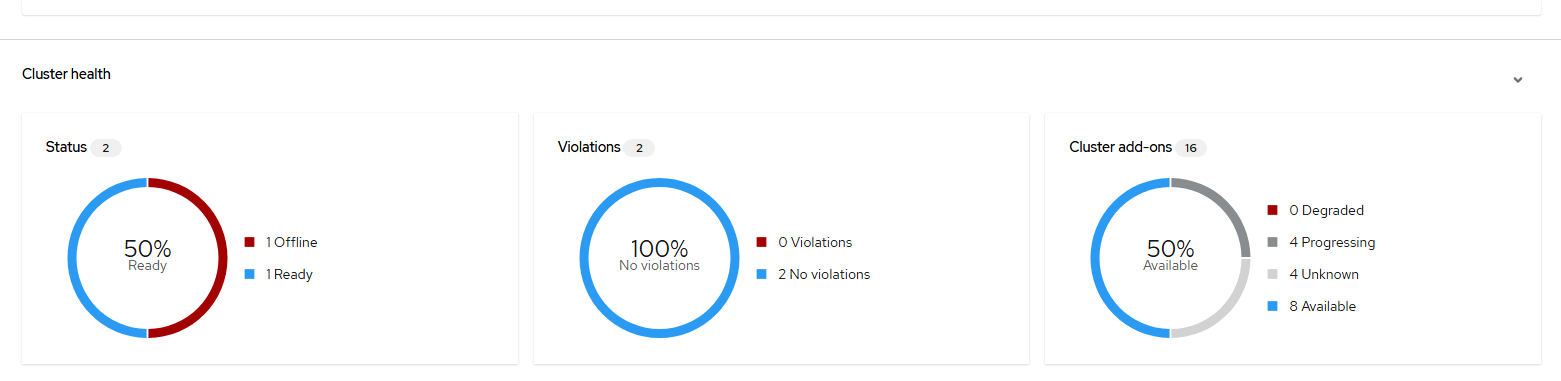
The next set of tiles show status information the managed clusters. For status, there is currently a cluster being built in my environment so it is showing offline. Violations refers to governance policies which will be explained some more shortly. Both clusters are compliant as no governance policies are currently setup.
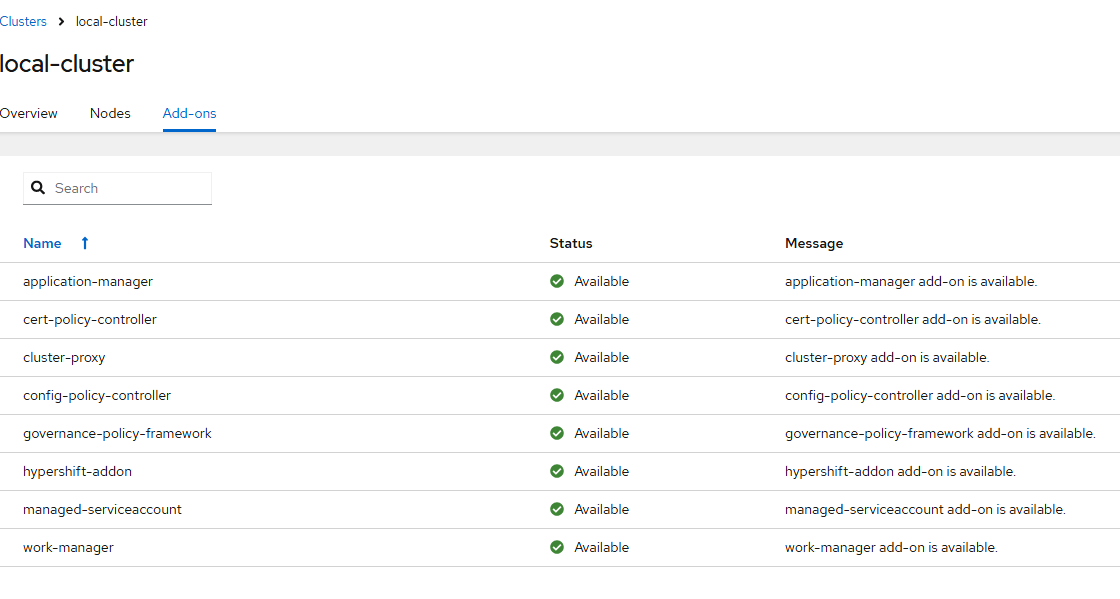
"Cluster add-ons" shows certain add-ons that are installed when a cluster is managed by ACM automatically and others. Right now, there are 4 in unknown status based on the one cluster still being installed. To view the available add-ons, go to Infrastructure menu –> Clusters and click on the cluster-name.
Here is a list of the add-ons available.
More information is available at the following link:
Search
The search view appears similar to the following:
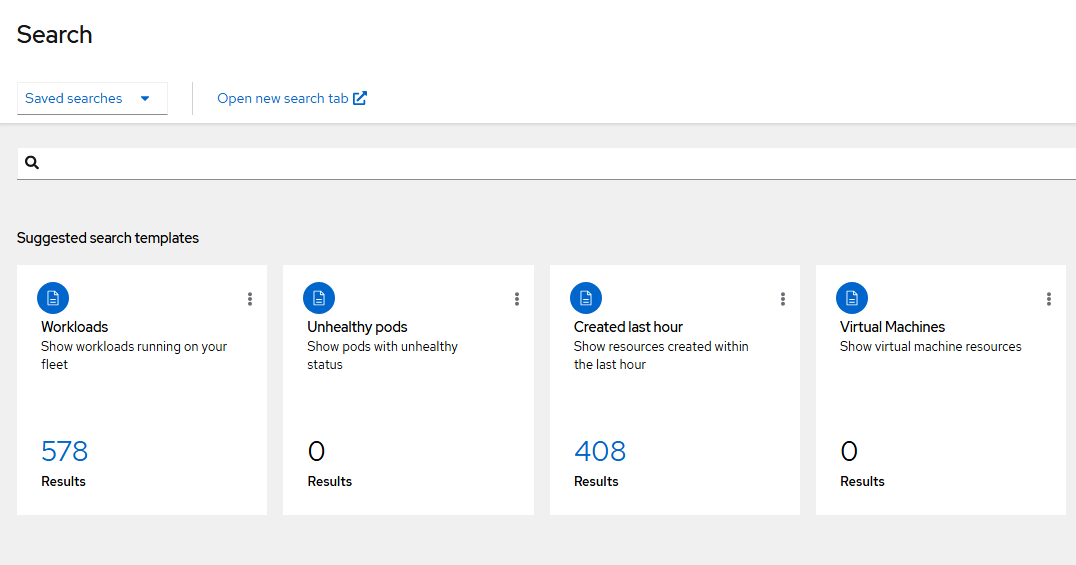
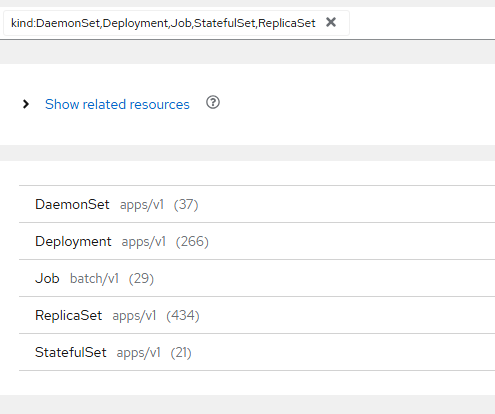
The search view will show 4 tiles by default. You can click on any of these to get more details. For example, let's click on "Workloads"
This will auto-populate the search bar to search for any daemonsets, deployments, jobs, statefulsets, or replicasets running on any of the managed clusters.
The views here can be customized based on the documentation below.
Here is an example on how these tiles can be customized.
kind: ConfigMap
apiVersion: v1
metadata:
  name: console-search-config
  namespace: open-cluster-management
data:
  suggestedSearches: |-
    [
      {
        "id": "search.suggested.workloads.name",
        "name": "Workloads",
        "description": "Show workloads running on your fleet",
        "searchText": "kind:DaemonSet,Deployment,Job,StatefulSet,ReplicaSet"
      },
      {
        "id": "search.suggested.unhealthy.name",
        "name": "Unhealthy pods",
        "description": "Show pods with unhealthy status",
        "searchText": "kind:Pod status:Pending,Error,Failed,Terminating,ImagePullBackOff,CrashLoopBackOff,RunContainerError,ContainerCreating"
      },
      {
        "id": "search.suggested.createdLastHour.name",
        "name": "Created last hour",
        "description": "Show resources created within the last hour",
        "searchText": "created:hour"
      },
      {
        "id": "search.suggested.virtualmachines.name",
        "name": "Virtual Machines",
        "description": "Show virtual machine resources",
        "searchText": "kind:VirtualMachine"
      }
    ]
This code is available at:
The search bar at the top of this screen has auto-complete so it will help you form queries.

Let's try some examples.
kind:pod status:running
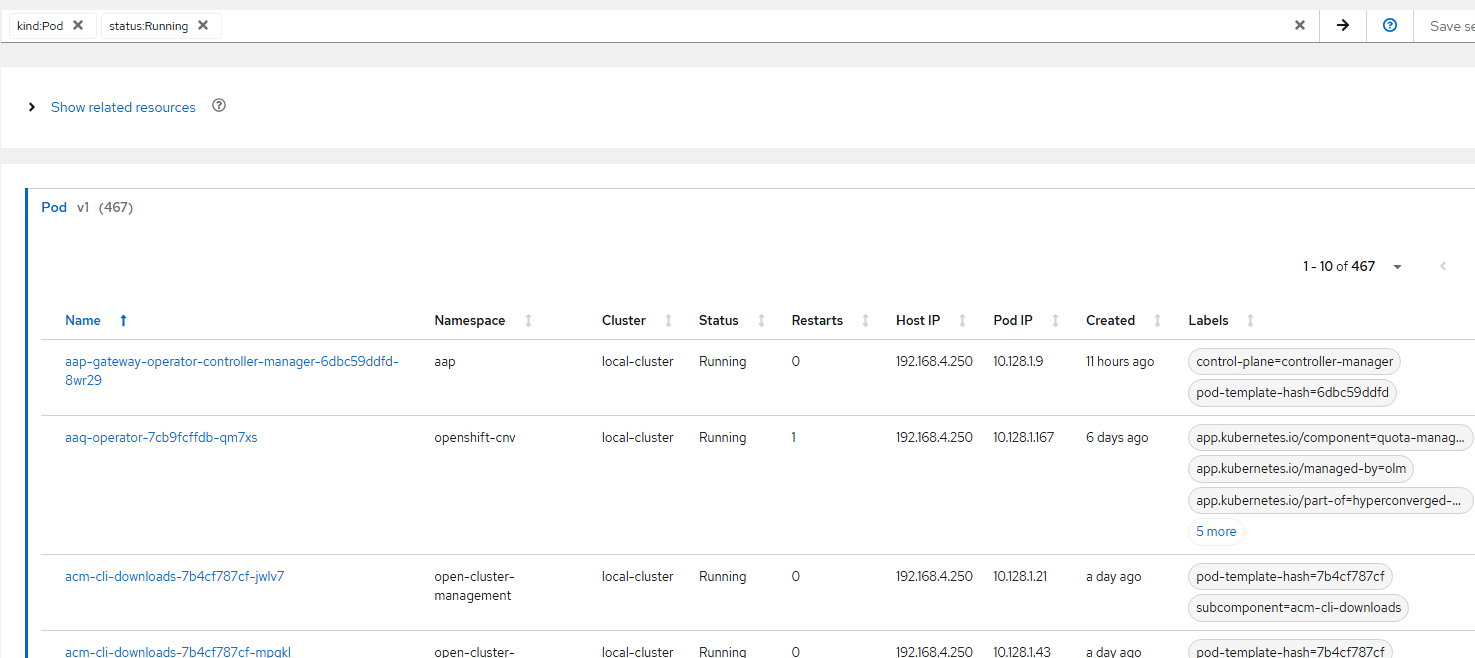
There are no failed pods in my cluster currently so failed does not show up here.
But clicking on the "Unhealthy Pods" tile populates this search
kind: pod, status:Pending,Error,Failed,Terminating,ImagePullBackOff,CrashLoopBackOff,RunContainerError,ContainerCreating
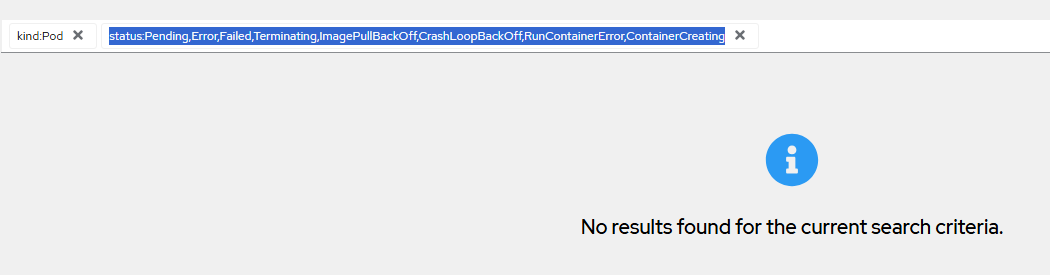
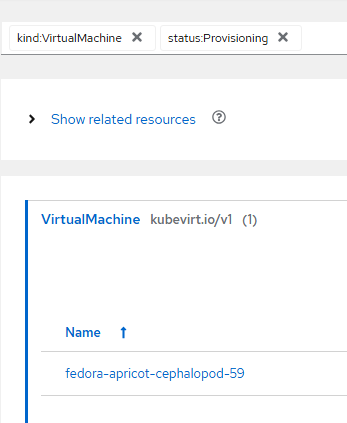
Let's try one more. Assume there are virtual machines in this environment and you want to view status information on these across all the managed clusters.
kind:virtualMachine, status:Provisioning
Infrastructure
Clusters
The "Clusters" menu shows a list of clusters that are being managed. You can click on any of the clusters to get more based on the nodes, workload details, etc.
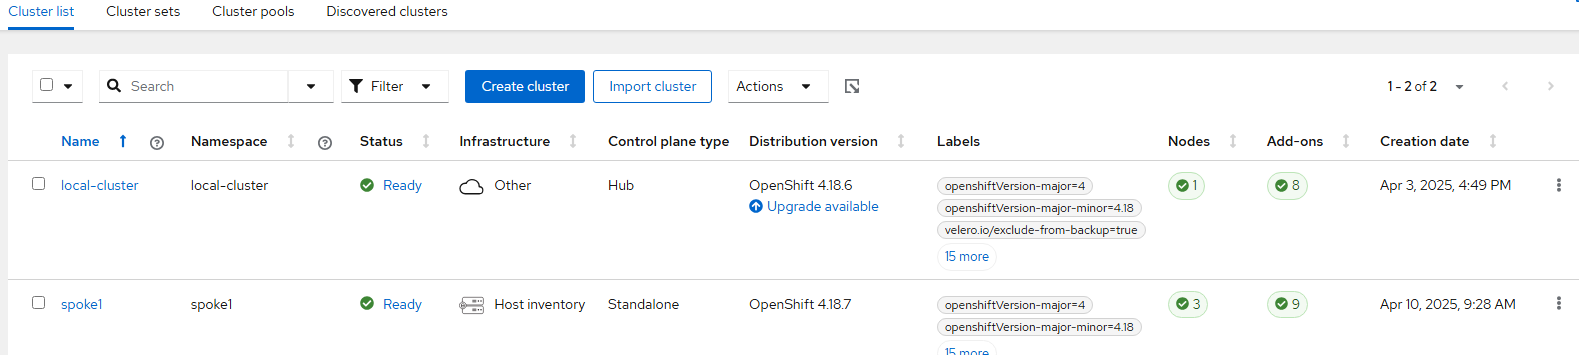
In the top part of the menu, there will be references to some other cluster resource groupings. I will only show the text information about these at this point. More information will be provided later.
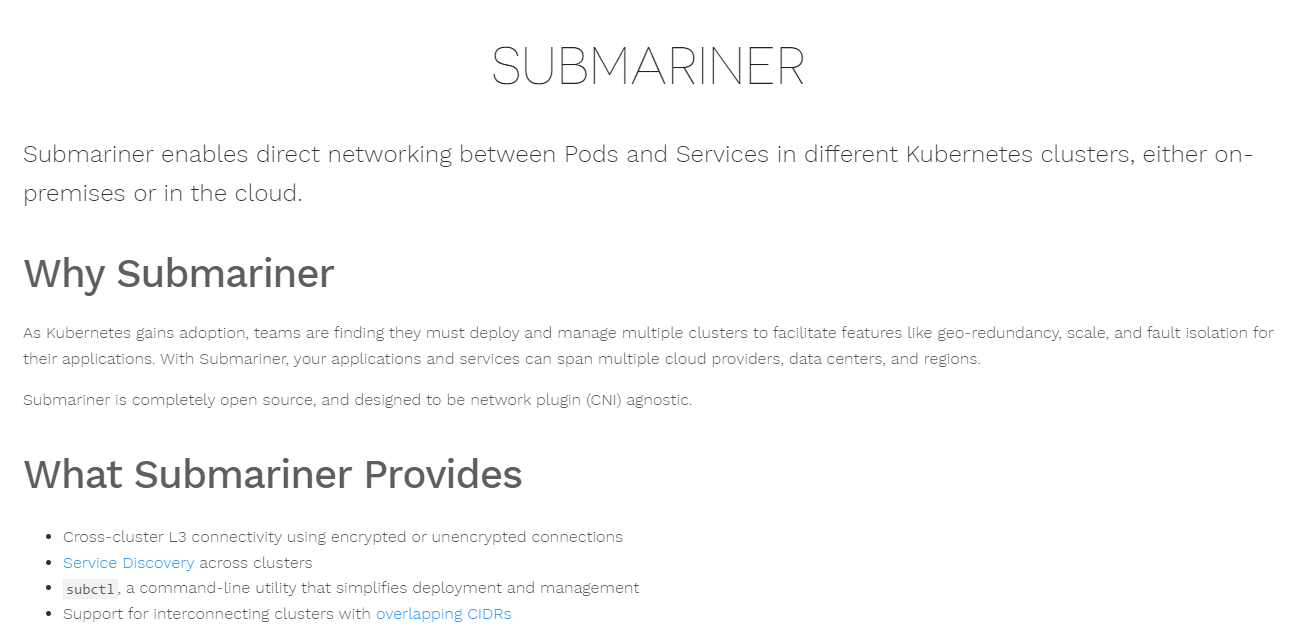
Cluster Sets:
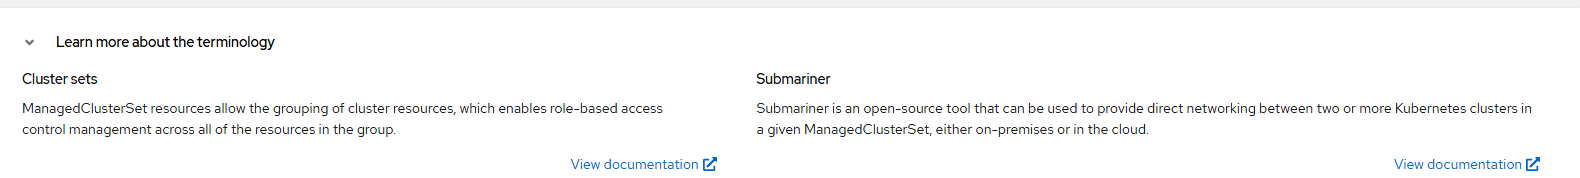
For more information on Submariner, see the following article:
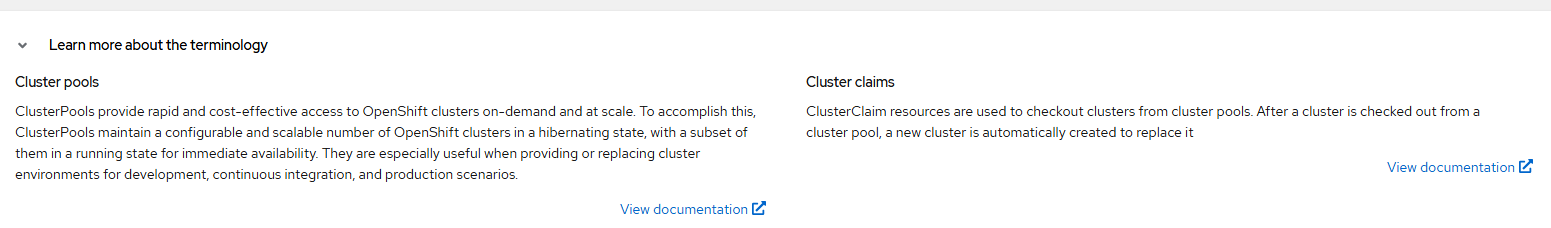
Cluster Pools:
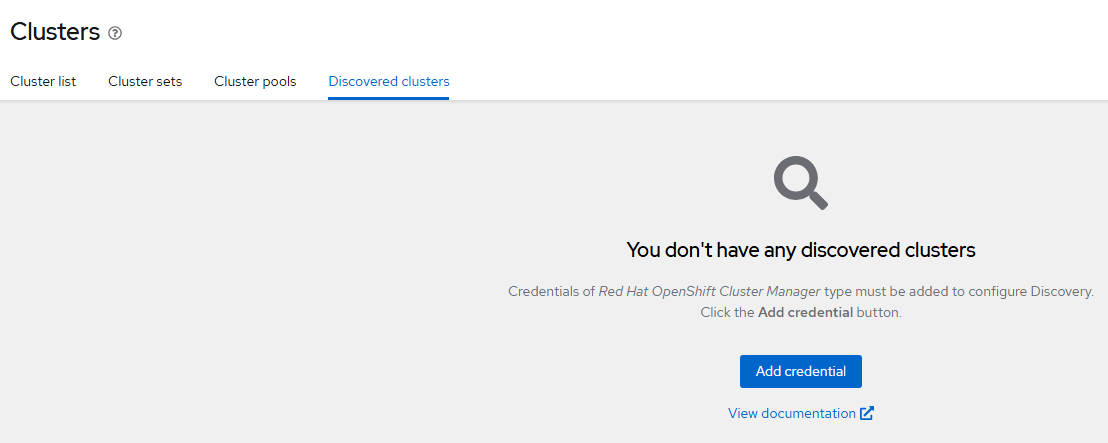
Discovered Clusters:
These clusters are other clusters that are registered to your RedHat ID. By providing your Red Hat credentials, these can be automatically discovered/managed.
Automation
These are integrations with Ansible which will be discussed more later. But here is a high-level overview from our official documentation
"multicluster engine operator is integrated with Red Hat Ansible Automation Platform so that you can create prehook and posthook Ansible job instances that occur before or after creating or upgrading your clusters. Configuring prehook and posthook jobs for cluster destroy, and cluster scale actions are not supported".
Host Inventory
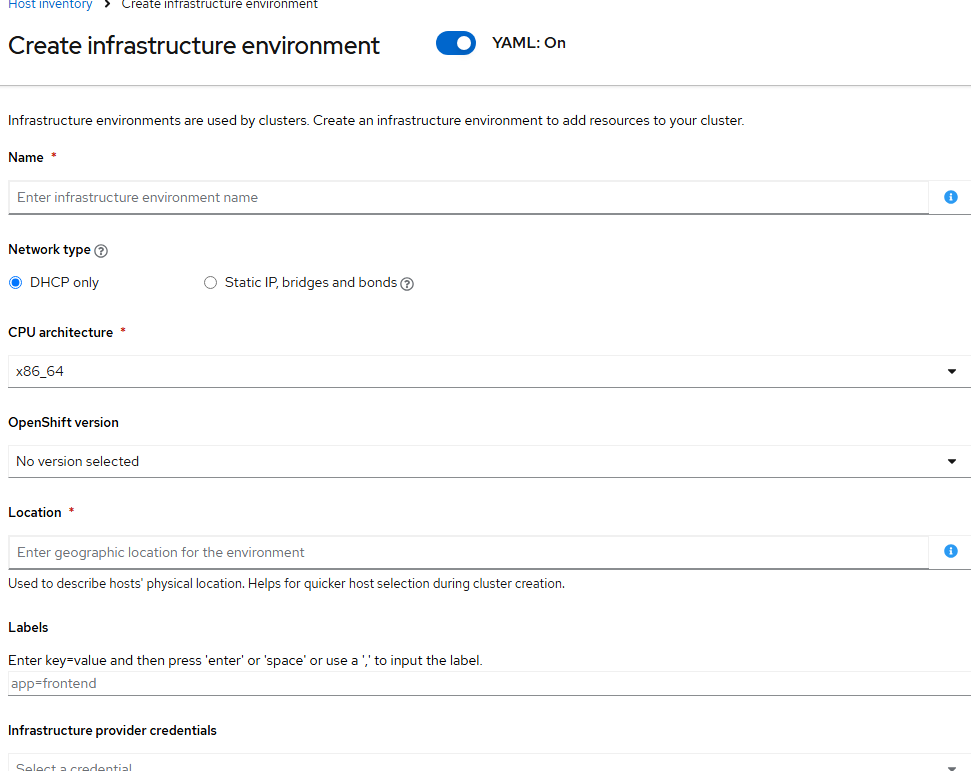
This section of the ACM GUI allows you to create Infrastructure environments and hosts that can be used to form another OCP cluster or add additional workers to an existing cluster.
Infrastructure environment is typically tied to some hierarchy such as physical location, department, etc.
An infrastructure environment consists of setting labels, network type (DHCP/static), OCP version, location/department, etc.
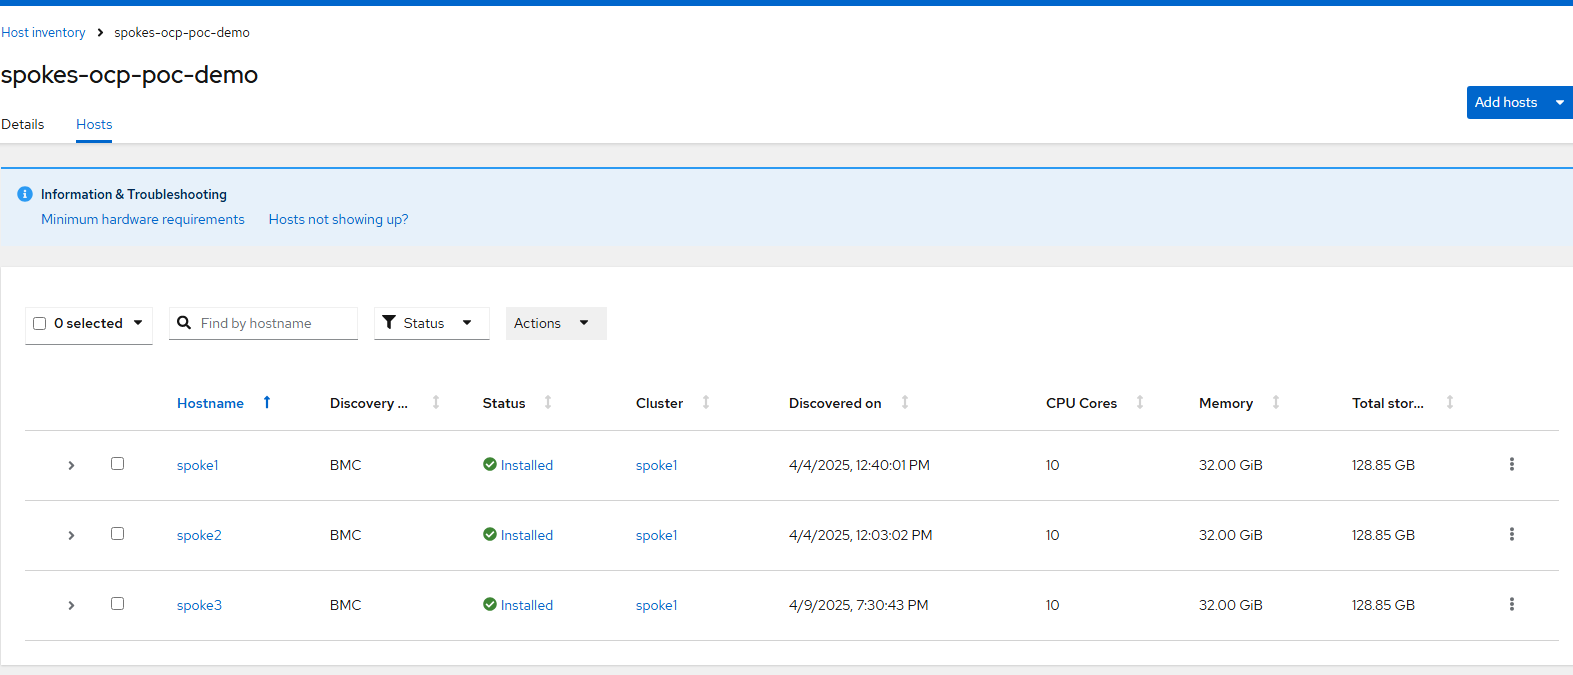
Once an Infrastructure environment is created, hosts can be added to it to be fully managed through ACM. The full lifecycle including creating clusters consuming these hosts, adding these hosts to existing clusters, and even tearing these down can all be managed through this mechanism. IDRAC, ILO, and other Redfish derivatives can be used to power on hosts, power down, attach media for install, etc.
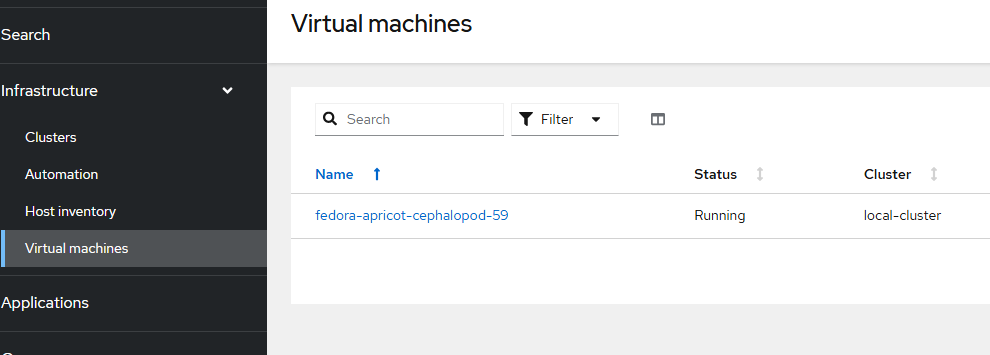
Virtual Machines
This view shows the list of virtual machines that are running in all managed clusters (by default).
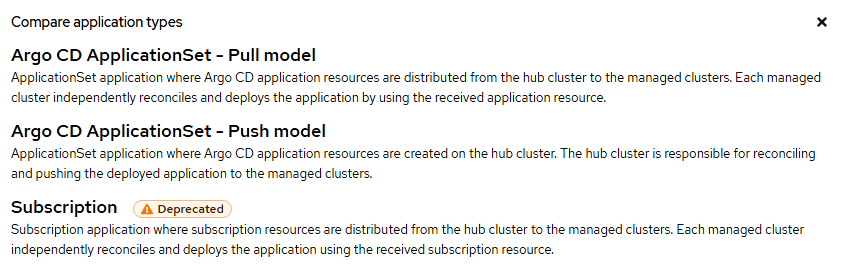
Applications
Future walkthroughs will be provided to show how applications can be deployed using GitOps model using ArgoCD. Workloads, applications, and even cluster configurations (infrastructure as code) can be deployed using a Gitops model.
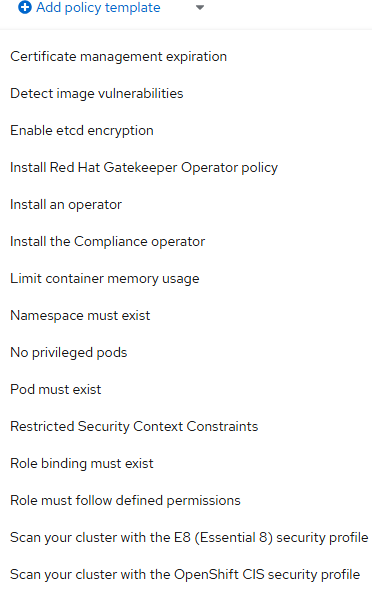
Governance
Think of governance rules as a way to deploy a certain configuration to a managed cluster. For instance, you can use this to install operators, log forwarding to a specific location automatically. Security rules can be applied as well. Here are some sample policy templates available out of the box.
Policies:
This will allow you to create policies from scratch.
Policy Sets:
A grouping of policies. For example, let's say you only want to deploy certain policies to a group of clusters based on location, department, or dev/test/prod context?
Discovered Policies:
These are some policies (admission webhooks) that are automatically installed on created clusters or other policies that are setup in Gitops to be discoverable.
Credentials
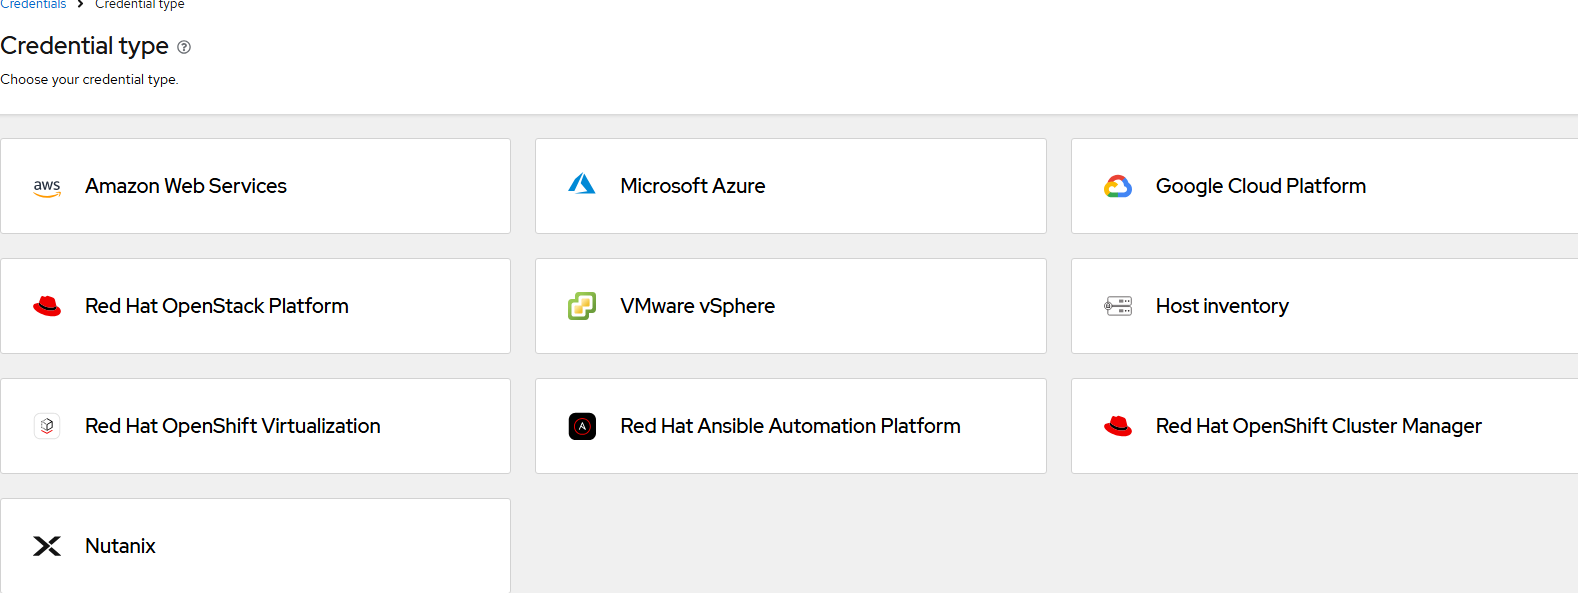
This screen allows you to setup credentials for your hosts that will be built automatically into clusters. The list above shows the types of environments that are supported. Various cloud providers are supported as well as bare-metal (IPMI/Redfish) based deployments via "Host Inventory".
I hope this walkthrough was helpful. Much more to come.