OpenShift Virtualization: Observability and Metering (Part 2)
In the second part of this series, I will be installing some of the operators that relate to logging, monitoring, metering, etc.
I will be writing this article based on our official documentation which is at:

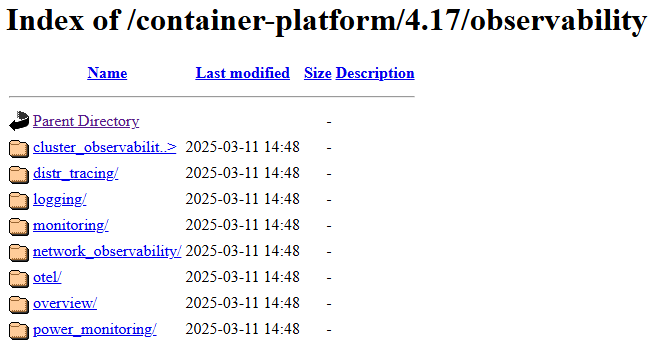
I know this link is just a tree-view of the directory but it shows you the different components of observability in a condensed-way.
Cluster Observability Operator
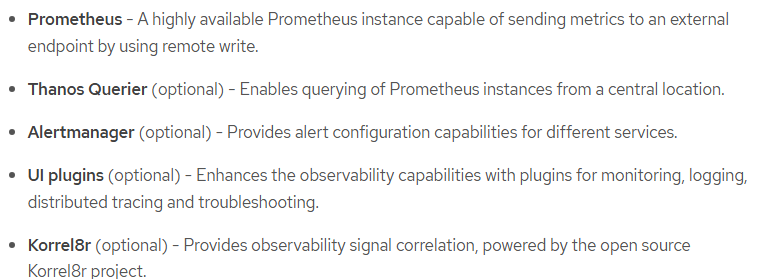
The Cluster Monitoring Operator allows the cluster administrator to do more customization beyond what is configured by default on the cluster. This is in relation to these components
See part 1 of this series for more on what is included for monitoring by default.
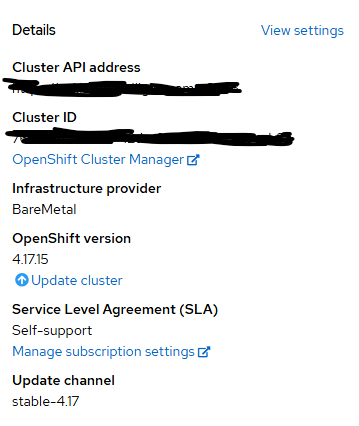
Here are the steps to install the Cluster Observability Operator
- On the OpenShift web console, go to Operators --> OperatorHub
- Search for "cluster observability"
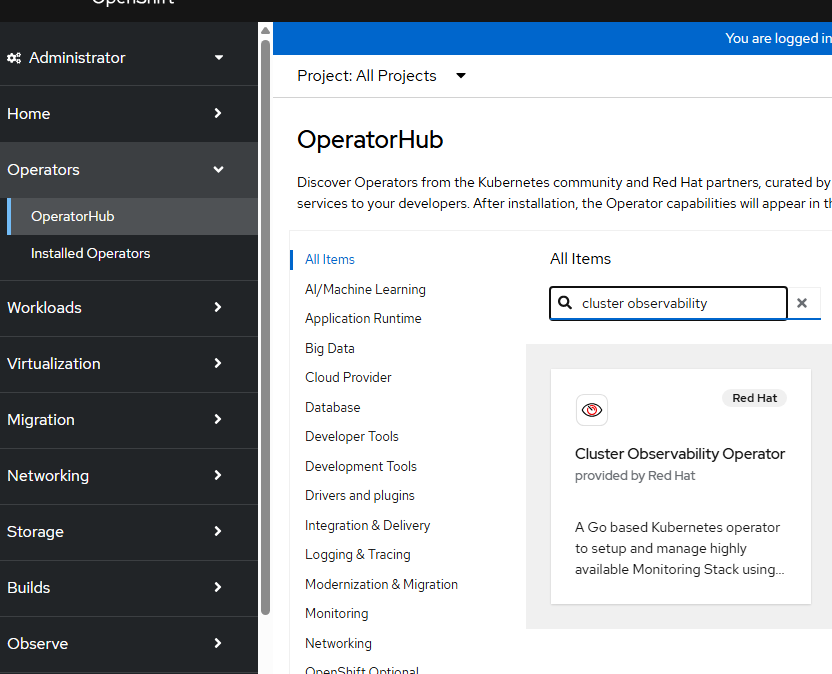
- At the time of this writing, version 1.0.0 is available. Click "Install"
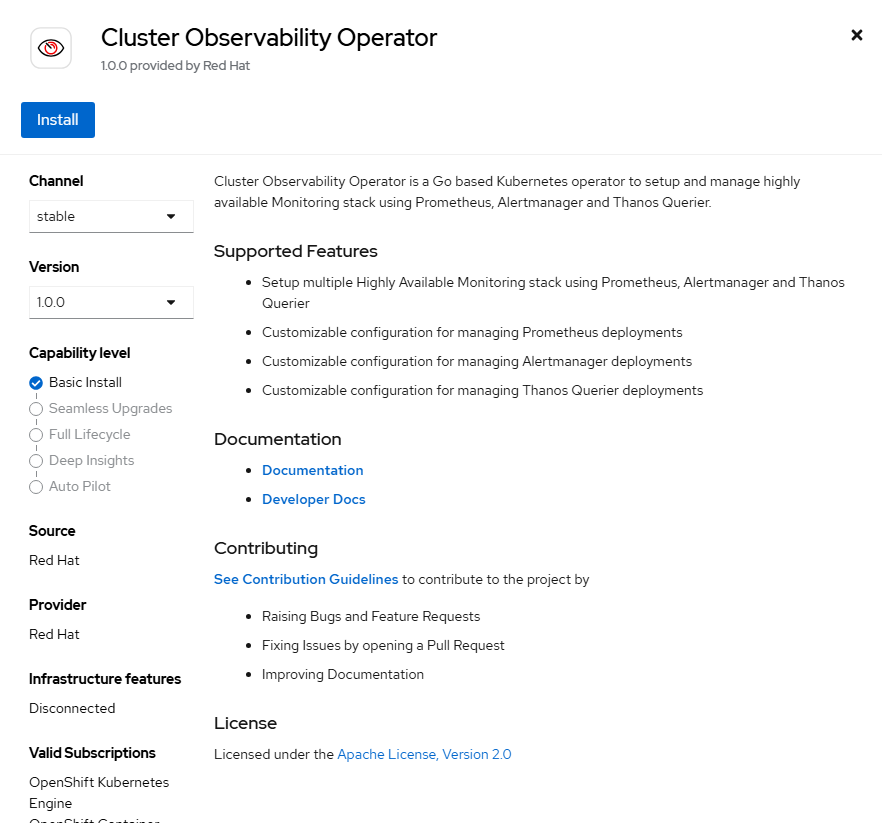
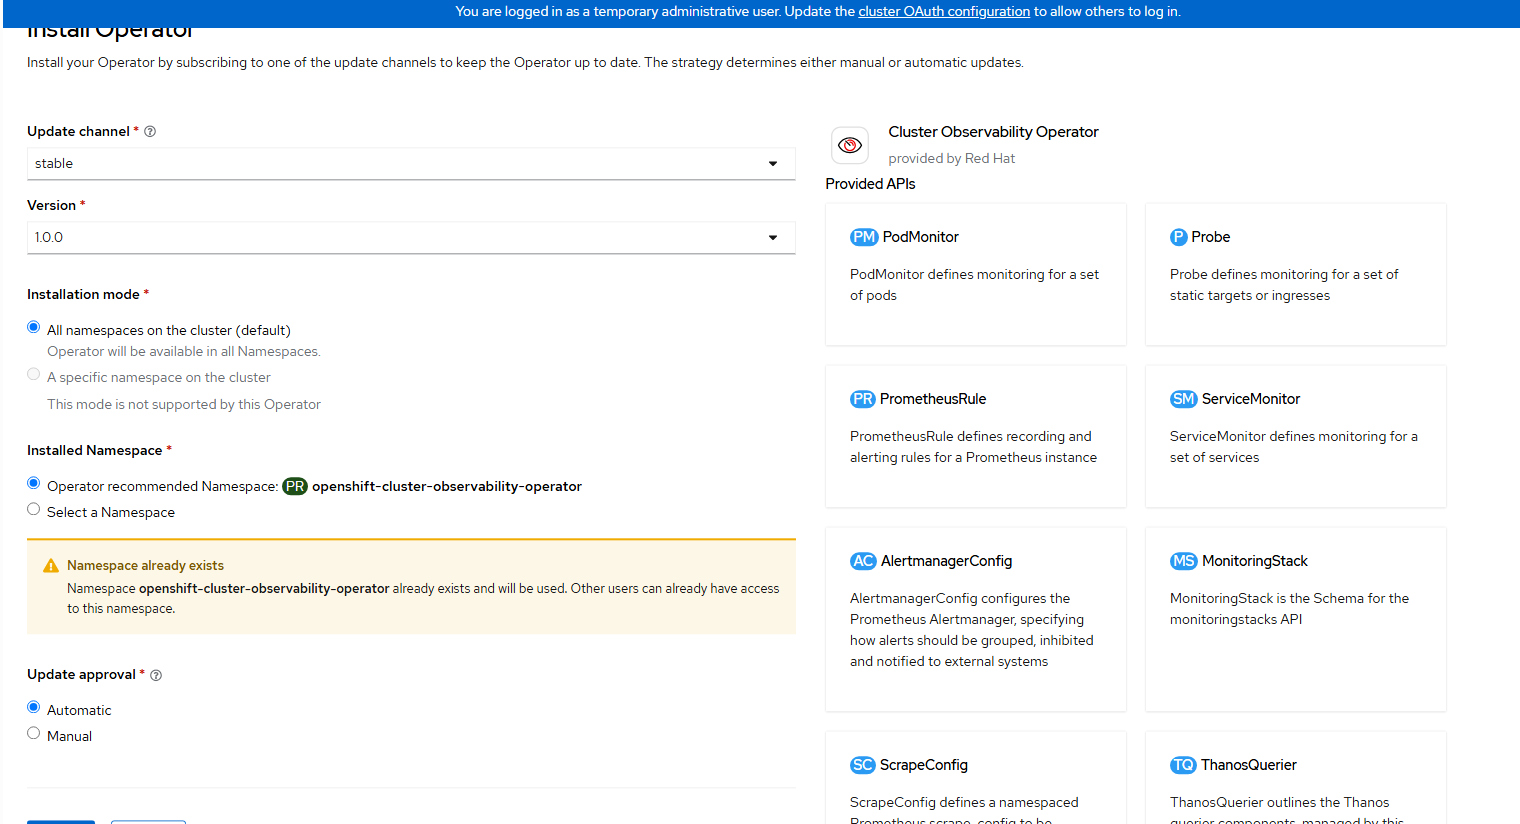
- Accept the default settings and click "Install". Some of the CRD (custom resource definitions) that are created with this operator are shown on the right-hand side. We will discuss some of these.
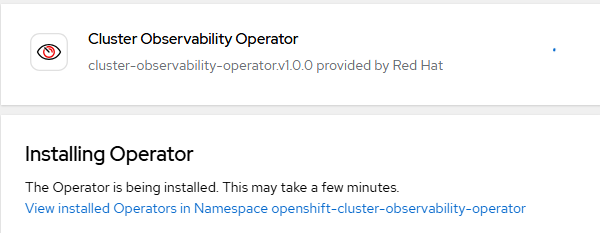
- Wait for the operator to install.
It will change to "Ready" status.
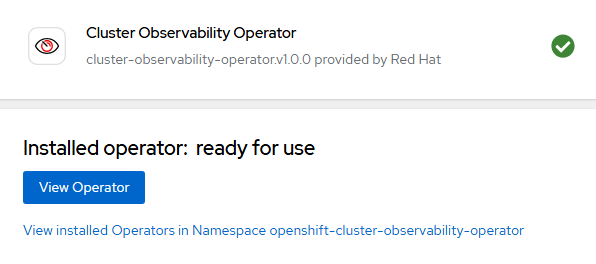
Click on "View Operator"
Enabling the Troubleshooting UI
Starting in Openshift 4.17, there is a new troubleshooting UI that allows a cluster administrator to be able to drill-down for more details on any alerts that are firing. This functionality is currently TechPreview (still being tested).
To enable this plugin:
- Go to Operators --> Installed Operators --> Cluster Observability Operator.
- Go to the UIPlugin tab and click "Create UIPlugin."
Go to YAML view and add the following definition
apiVersion: observability.openshift.io/v1alpha1
kind: UIPlugin
metadata:
  name: troubleshooting-panel
spec:
type: TroubleshootingPanel- Wait for the troubleshooting-panel UIPlugin to become available.

- When going to Observe --> Alerting, click on any of the alerts. In this example, I will click on "CDIDataImportCronOutdated" alert.

There will be a "Troubleshooting Panel" link on the screen (see right-side). Click on this.

This will show a GUI that allows you to drill down to obtain more detail about the alert that is firing to help with troubleshooting purposes.
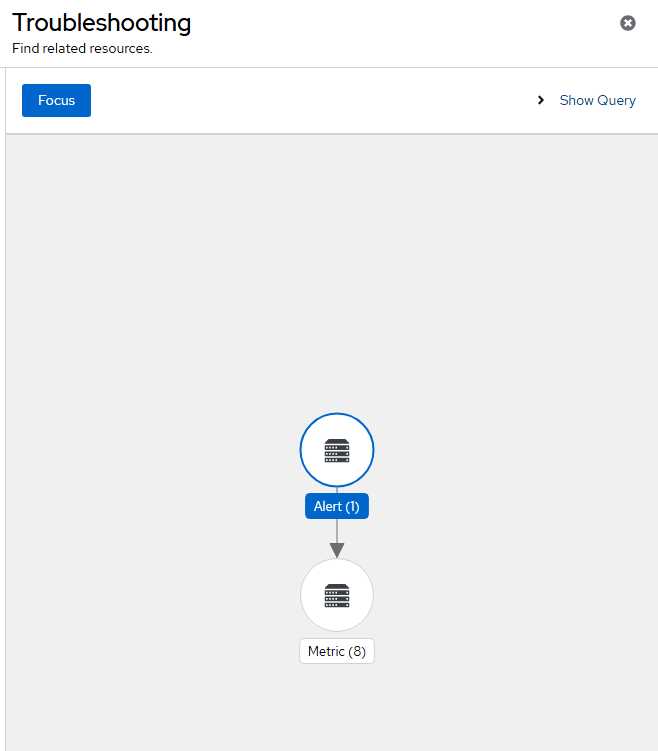
I will click on "Metric (8)"
In the output below, I will see the associated objects that are in this error state.

The query that is being run for this alert is "sum by (ns, cron_name) (kubevirt_cdi_dataimportcron_outdated{pending="false"}) > 0" meaning that it will display any boot volume imports for virtual machines that are outdated.
To dig into this specific message in more detail, I would go to Administration --> CustomResourceDefinitions --> search for DataImportCrons

When looking at the YAML details of these objects, I know these are failing because the server hosting these images is no longer available.
Enabling Logging UI
Follow these steps to enable logging based on Logging version 6.1
**NOTE: VIAQ is the default log provider/data model as of Openshift 4.17. OpenTelemetry is still Technology Preview but will be the standard going forward **

- Install the Red Hat OpenShift Logging Operator
Click on Operators --> OperatorHub and search for "Openshift Logging"
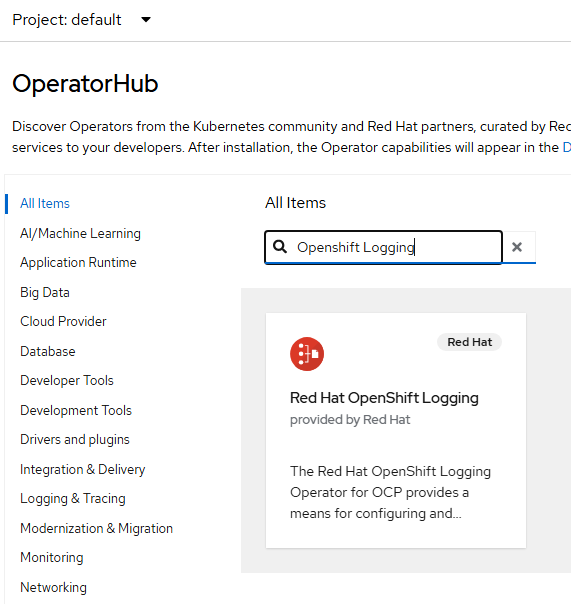
Click "Install". Accept all defaults again and click "Install"
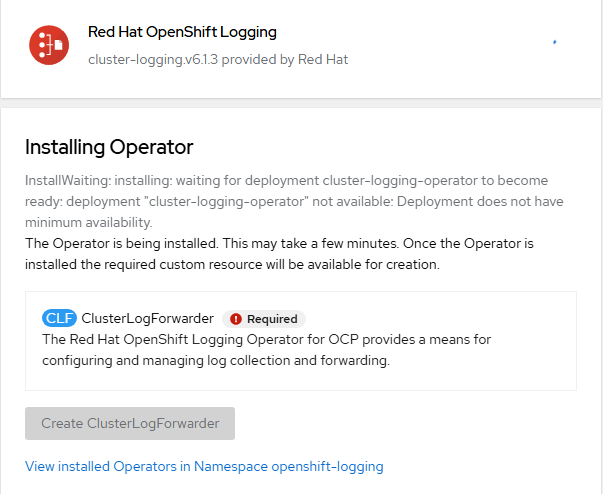
"Create ClusterLogForwarder" option will light-up when the install is finished. Let's not configure anything additional for this at the moment.
- Install the Loki operator.
In Operators --> OperatorHub, search for "Loki Operator". Ensure that you are using the RedHat one as shown below.
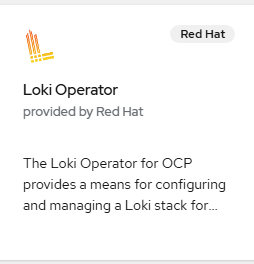
Click "Install". Accept all defaults again and click "Install"
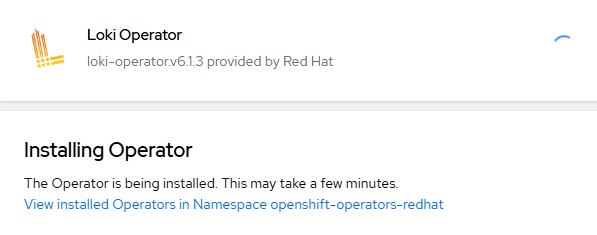
When the operator says "Ready to Use", click on "View Operator"
- Now, we need to create the S3 bucket that will be used for Loki. In my environment, I am using Openshift Data Foundation for storage. If you are using another provider, you will create the secret as shown in step x
Go to Storage --> Object Storage
Ensure the project is changed to "openshift-logging"

Click "Create ObjectBucketClaim"
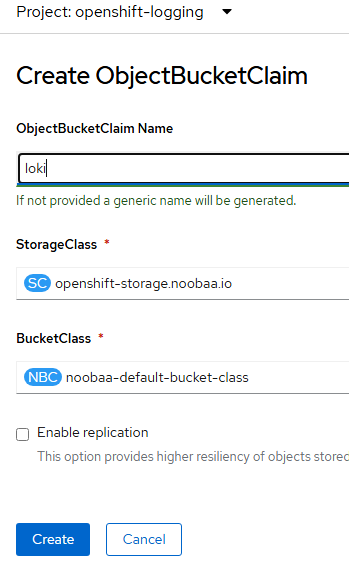
Let's call the ObjectBucketClaim name to be "loki" and use noobaa as shown above.
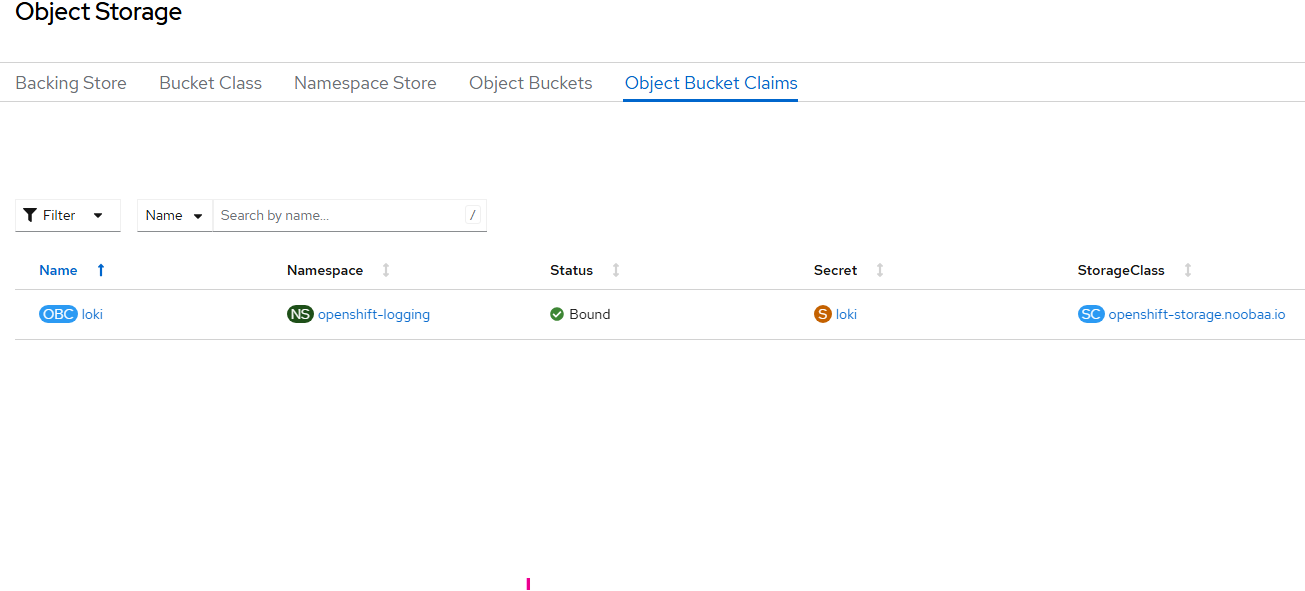
- Once this is created, there will be an associated secret. The secret name is the same as the ObjectBucketClaim name (loki).
BUCKET_HOST=$(oc get -n openshift-logging configmap loki -o jsonpath='{.data.BUCKET_HOST}')BUCKET_NAME=$(oc get -n openshift-logging configmap loki -o jsonpath='{.data.BUCKET_NAME}')BUCKET_PORT=$(oc get -n openshift-logging configmap loki -o jsonpath='{.data.BUCKET_PORT}')Get the access and secret keys
ACCESS_KEY_ID=$(oc get -n openshift-logging secret loki -o jsonpath='{.data.AWS_ACCESS_KEY_ID}' | base64 -d)SECRET_ACCESS_KEY=$(oc get -n openshift-logging secret loki -o jsonpath='{.data.AWS_SECRET_ACCESS_KEY}' | base64 -d)Create the secret
oc create -n openshift-logging secret generic logging-loki-s3 --from-literal=access_key_id=$ACCESS_KEY_ID --from-literal=access_key_secret=$SECRET_ACCESS_KEY --from-literal=bucketnames=$BUCKET_NAME --from-literal=endpoint="https://$BUCKET_HOST:$BUCKET_PORT"5. Let's now create our Lokistack instance.
Go to Operators --> Installed Operators -->Loki Operator
Create a LokiStack resource.
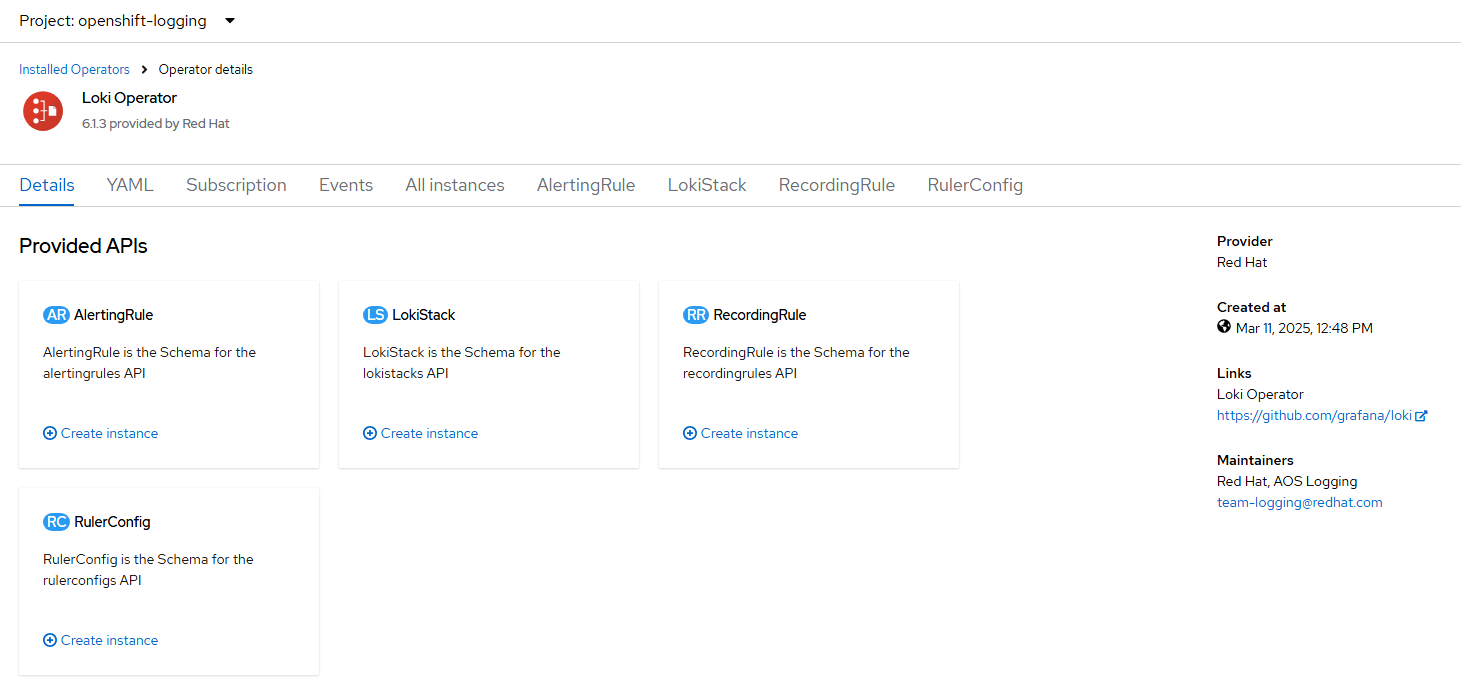
Go to YAML view and paste the following:
For your StorageClass name, use one that supports FileSystem ReadWriteOnce. In my case, this is provided by ocs-storagecluster-cephfs based on ODF (Openshift Data Foundation).
apiVersion: loki.grafana.com/v1
kind: LokiStack
metadata:
  name: logging-loki
  namespace: openshift-logging
spec:
  managementState: Managed
  size: 1x.extra-small
  storage:
    schemas:
    - effectiveDate: '2024-10-01'
      version: v13
    secret:
      name: logging-loki-s3
      type: s3
  storageClassName: ocs-storagecluster-cephfs
  tenants:
mode: openshift-logging- On the command-line, run the following commands
oc create sa collector -n openshift-loggingoc adm policy add-cluster-role-to-user logging-collector-logs-writer -z collectoroc project openshift-loggingoc adm policy add-cluster-role-to-user collect-application-logs -z collectoroc adm policy add-cluster-role-to-user collect-audit-logs -z collectoroc adm policy add-cluster-role-to-user collect-infrastructure-logs -z collector- Create the UIPlugin for logging
Go to Operators --> Installed Operators --> Cluster Observability Operator
Go to UIPlugin tab
Create UIPlugin and then edit the YAML
apiVersion: observability.openshift.io/v1alpha1
kind: UIPlugin
metadata:
  name: logging
spec:
  type: Logging
  logging:
    lokiStack:
name: logging-loki- A pop-up window should appear shortly showing that an updated menu is available. Click on "Refresh web console".

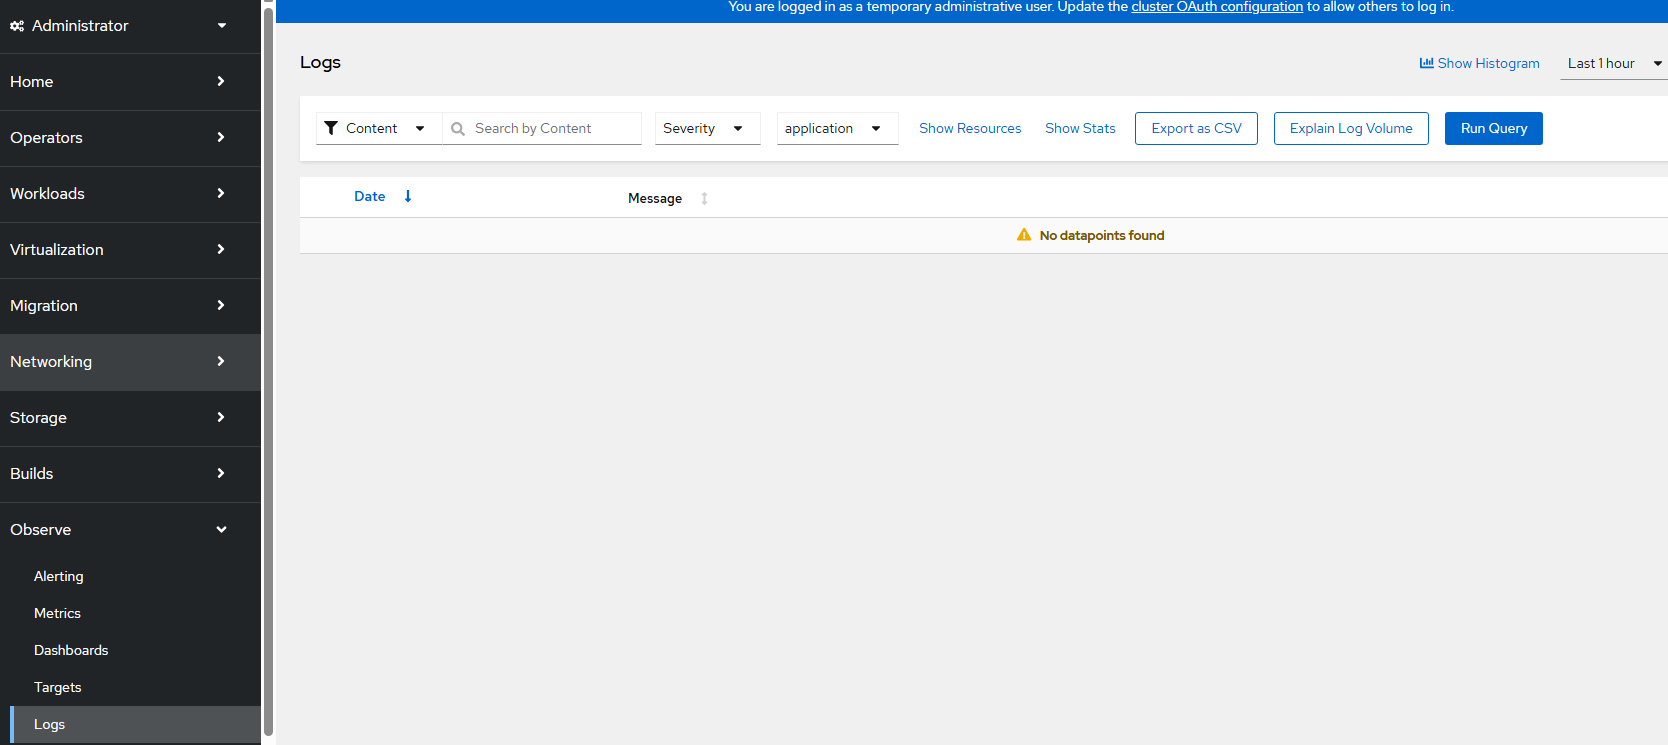
- An Observe --> Logs menu will now appear but be empty
- Let's create the ClusterLogForwarder resource.
Go to Operators --> Installed Operators --> Red Hat Openshift Logging
An option to create ClusterLogForwarder will appear
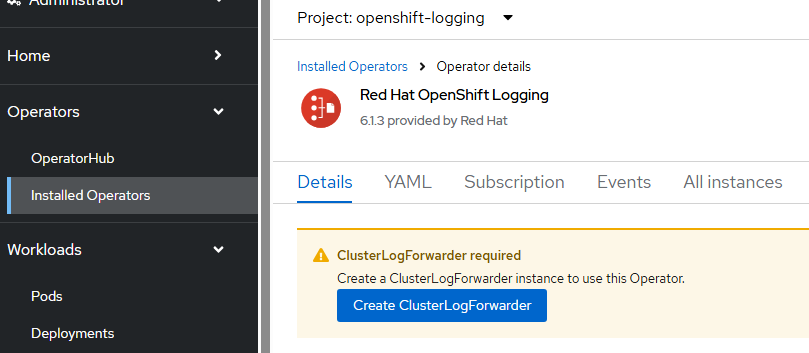
Click "Create ClusterLogForwarder"
On the resulting screen, apply the following YAML definition
apiVersion: observability.openshift.io/v1
kind: ClusterLogForwarder
metadata:
  name: collector
  namespace: openshift-logging
spec:
  serviceAccount:
    name: collector
  outputs:
  - name: default-lokistack
    type: lokiStack
    lokiStack:
      authentication:
        token:
          from: serviceAccount
      target:
        name: logging-loki
        namespace: openshift-logging
    tls:
      ca:
        key: service-ca.crt
        configMapName: openshift-service-ca.crt
  pipelines:
  - name: default-logstore
    inputRefs:
    - application
    - infrastructure
    outputRefs:
- default-lokistack- The ClusterLogForwarding object will show available in a few minutes.

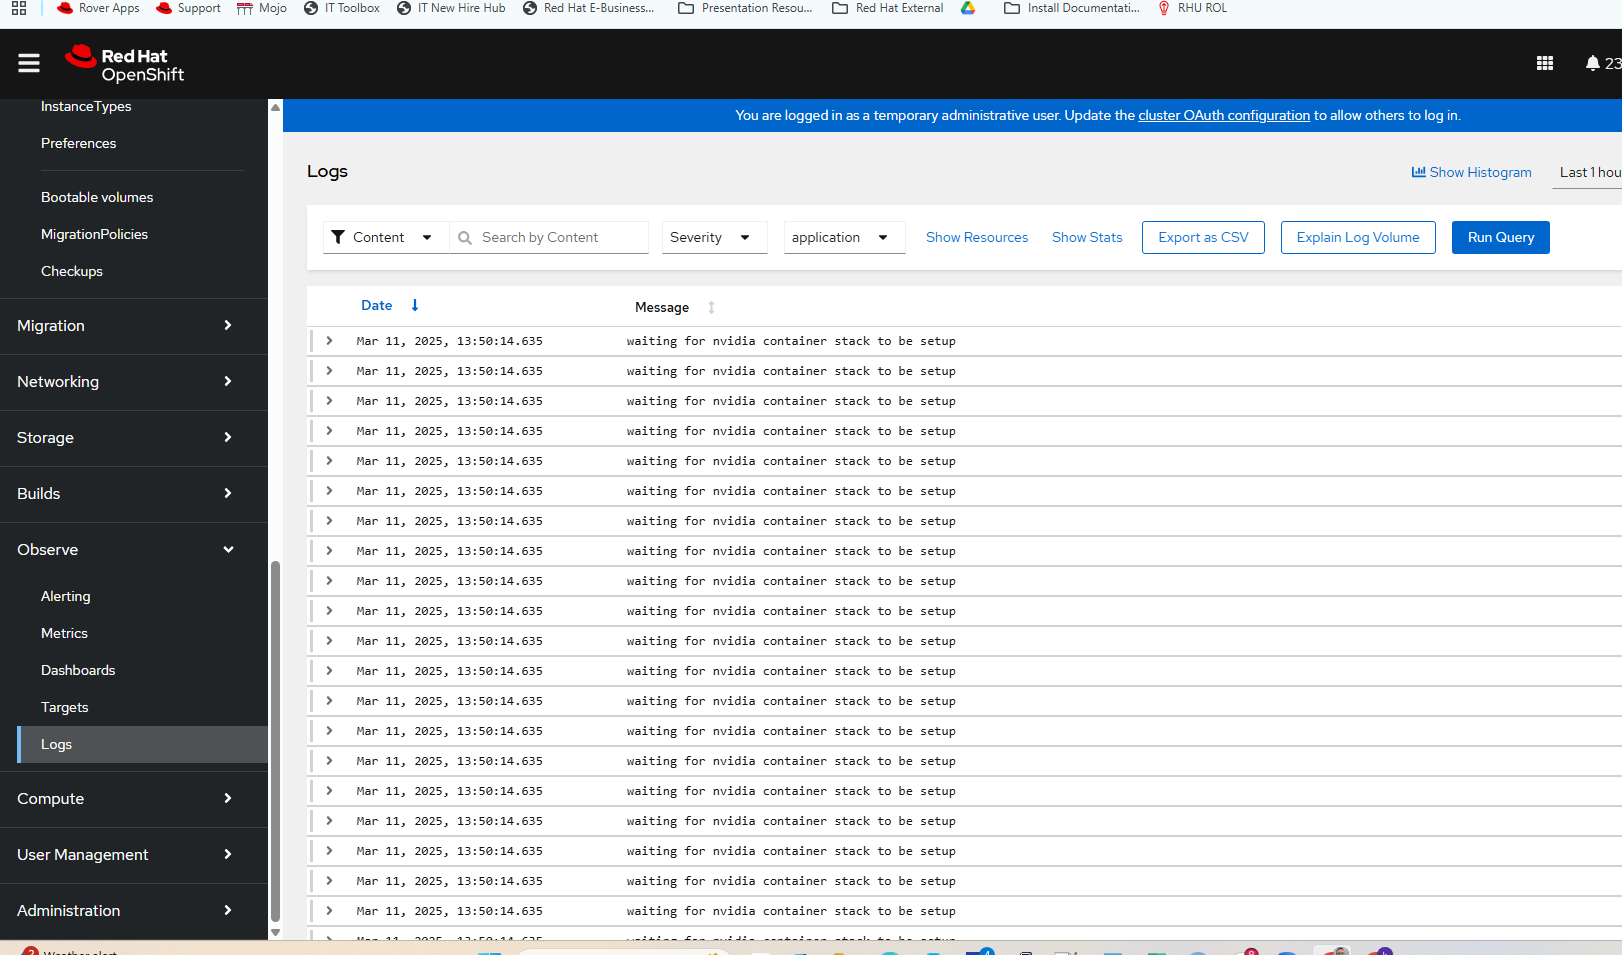
- Wait a few more minutes and the Observe --> Logs view will show new logs coming in.
This is the stopping point for this second part of the series. I hope you enjoyed this. Part 3 (and possibly 4) to come soon.
